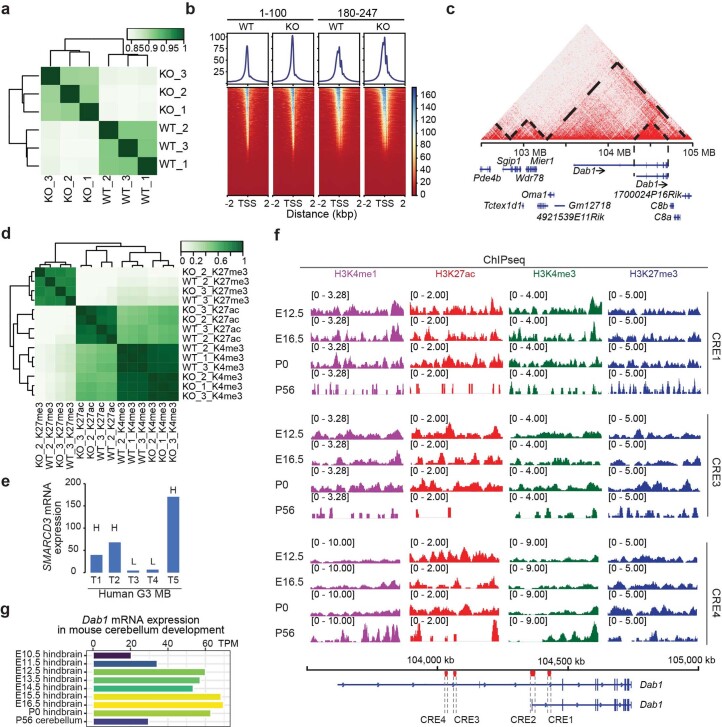
Extended Data Fig. 6. SMARCD3 modulates chromatin architecture for gene regulation.
a, Pearson correlation analysis of ATACseq replicates of MED8A cells with SMARCD3 KO vs WT. b, Mean accessibility and enrichment of ATACseq data with different insert lengths around transcription start site (TSS). c, Hi-C chromatin interaction map on a region centered in the Dab1 gene of mouse cerebellum (P22). The dashed lines outline TAD borders. d, Pearson correlation analysis of histone marker binding signals from CUT&RUN replicates of MED8A cells with SMARCD3 KO vs WT. e, Histogram of SMARCD3 mRNA expression (FPKM) in 5 G3 patient samples. Each tumor (T) is marked with higher (H), or lower (L), levels of SMARCD3 expression. f, Histone modification signals at CRE1, CRE3, and CRE4 at the locus of the Dab1 gene based on analyzing ChIPseq data of mouse hindbrain or cerebellum samples. These CREs in the mouse are homologous to the human CREs of the DAB1 gene. g, Histogram of Dab1 mRNA expression (TPM) during mouse cerebellar development at indicated time points.

