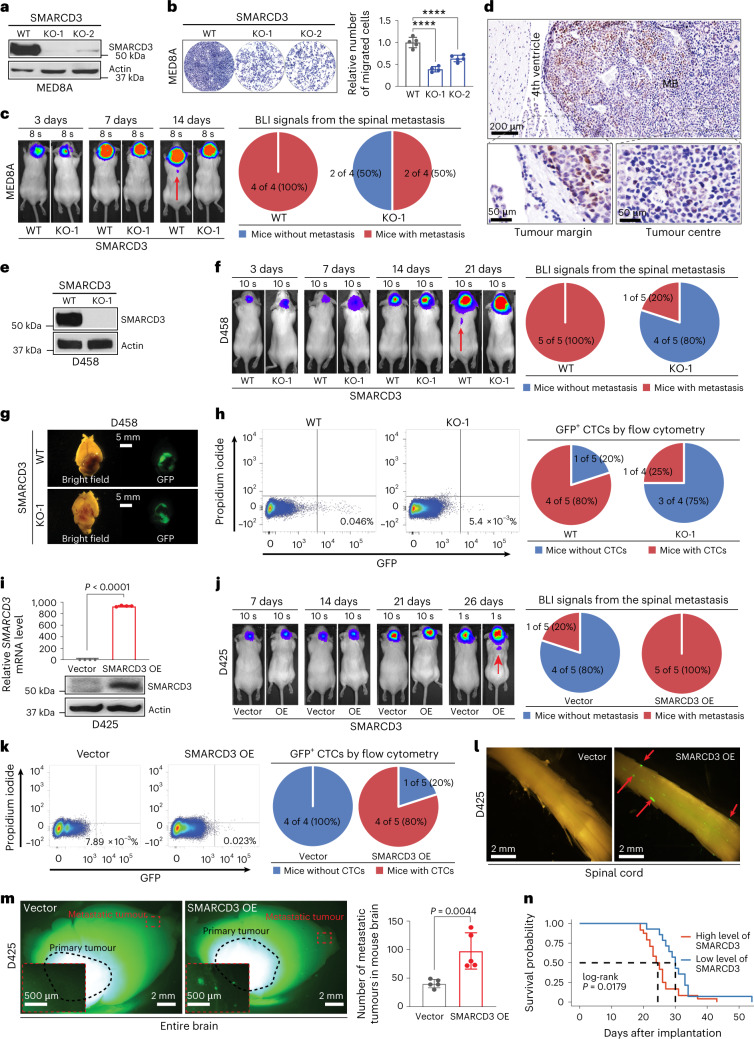
Fig. 2. SMARCD3 promotes cell migration and tumour metastasis.
a, IB for SMARCD3 expression in MED8A cells with control (WT) and SMARCD3 KO using two independent single-guide RNAs (sgRNAs; KO-1 and KO-2). b, Representative images (left) and quantification (right) showing cell migration of MED8A cells with SMARCD3 WT (n = 5), KO-1 (n = 5) or KO-2 (n = 5) in Transwell assays. c, Representative luminescence images (left) and pie charts (right) showing mice bearing MED8A cells with SMARCD3 WT or KO-1 after implantation. d, Representative IHC staining of SMARCD3 in MED8A-derived xenograft MB tumours. High-magnification images show a part of the tumour margin and core areas. e, IB for SMARCD3 expression in D458 cells with SMARCD3 WT or KO-1. f, Representative luminescence images (left) and pie charts (right) showing mice bearing D458 cells with SMARCD3 WT or KO-1 after implantation. g, Representative bright-field and fluorescence microscopy images of mouse brains bearing D458 cells with SMARCD3 WT or KO. h, Flow cytometry (left) and pie chart (right) analysis of GFP+ CTCs from peripheral blood mononuclear cells (PBMCs) of mice bearing D458 cells with SMARCD3 WT or KO (GFP+ ≥ 0.01%). i, RT–qPCR (top) and IB (bottom) for the SMARCD3 mRNA and protein expression levels in D425 cells with vector (n = 4) or SMARCD3 OE (n = 4). j, Representative luminescence images (left) and pie charts (right) showing mice bearing D425 cells with vector or SMARCD3 OE after implantation. k, Flow cytometry (left) and pie chart (right) analysis of GFP+ CTCs from PBMCs of mice bearing D425 cells with vector or SMARCD3 OE. l, Representative bright-field and fluorescence microscopy images of the spinal cords from mice bearing D425 cells with vector or SMARCD3 OE. m, Left: representative fluorescence stereoscopic images of mouse brain tumours derived from D425 cells with vector (n = 5) or SMARCD3 OE (n = 5). Insets: high-magnification images were donated. Right: histograms showing the number of brain metastases. n, Kaplan–Meier survival curve of the grouped mice bearing cells with high (MED8A, D458, D425-SMARCD3 OE) or low (MED8A-SMARCD3 KO, D458-SMARCD3 KO, D425) levels of SMARCD3 expression. The red arrow denotes the metastatic tumour observed by in vivo (c,f,j) or fluorescence (l) imaging. n represents the number of biologically independent samples (b,i) or mice (m). Data are presented as the mean ± s.d. P values were calculated using one-way ANOVA with Dunnett’s multiple comparison test (b) or one-tailed unpaired t-test (i,m). ∗∗∗∗P < 0.0001. At least five (a,d,e,g,m) or four (l) replicates per experiment were repeated independently, with similar results obtained.

