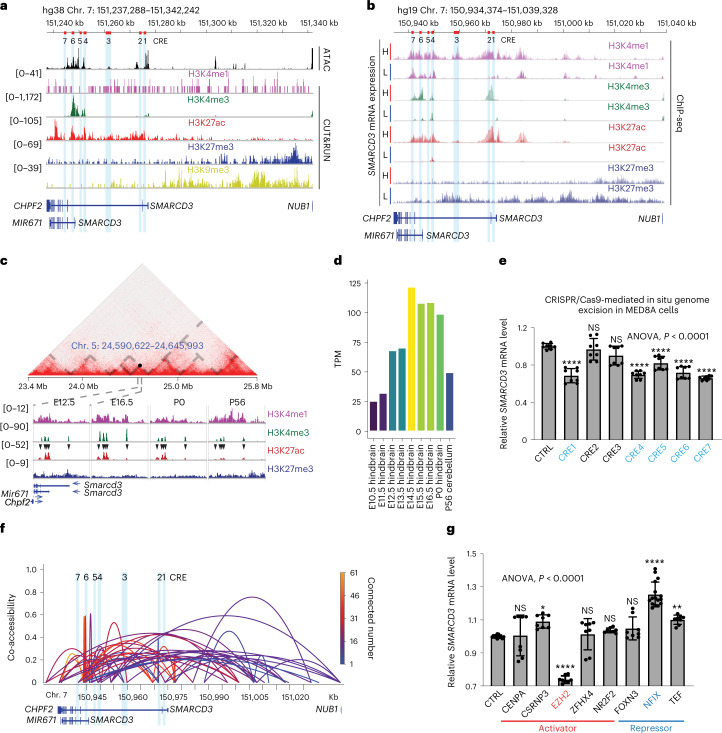
Fig. 6. TF-mediated chromatin hubs control SMARCD3 transcriptional activation in cerebellar development and MB.
a, ATAC-seq and histone-modification signals from CUT&RUN at the SMARCD3 locus in MED8A cell. The CREs (1–7) are marked with red bars in the schematic of the genome (top) and in light blue. b, Histone-modification signals at the SMARCD3 locus based on analyses of ChIP-seq data from five samples from patients with G3. c, Hi-C chromatin interaction map on a region centred in the Smarcd3 locus in mouse cerebellum (P22). Grey dashed lines outline topologically associating domain borders. Histone-modification signals are based on analyses of ChIP-seq data of mouse cerebellum samples at the indicated time points. Black arrowheads denote the CREs that are homologous to the CREs in MED8A cells. d, Histogram of Smarcd3 mRNA expression during mouse cerebellar development. TPM, transcripts per million. e, RT–qPCR analysis of SMARCD3 mRNA expression in MED8A cells after CRISPR–Cas9-mediated in situ CRE excision (n = 8 for each group). Excision of CREs in blue caused significant decreases in SMARCD3 mRNA levels. f, Cicero co-accessibility links among SMARCD3 CREs in PCs using sci-ATAC-seq3 data from the human cerebellum. The height and colour of connections indicate the magnitude of the Cicero co-accessibility score and the number of connected peaks. g, RT–qPCR analysis of SMARCD3 mRNA expression in MED8A cells after CRISPR–Cas9-mediated KO of the indicated TF (nCTRL = 12, nCENPA = 8, nCSRNP3 = 8, nEZH2 = 8, nZFHX4 = 8, nNR2F2 = 8, nFOXN3 = 8, nNFIX = 16, nTEF = 8). n represents the number of biologically independent samples from at least three independent experiments. Data are presented as the mean ± s.d. P values were calculated using one-way ANOVA with Dunnett’s multiple comparisons test (e,g). NS, not significant, ∗P = 0.0203, ∗∗P = 0.0070, ∗∗∗∗P < 0.0001.

