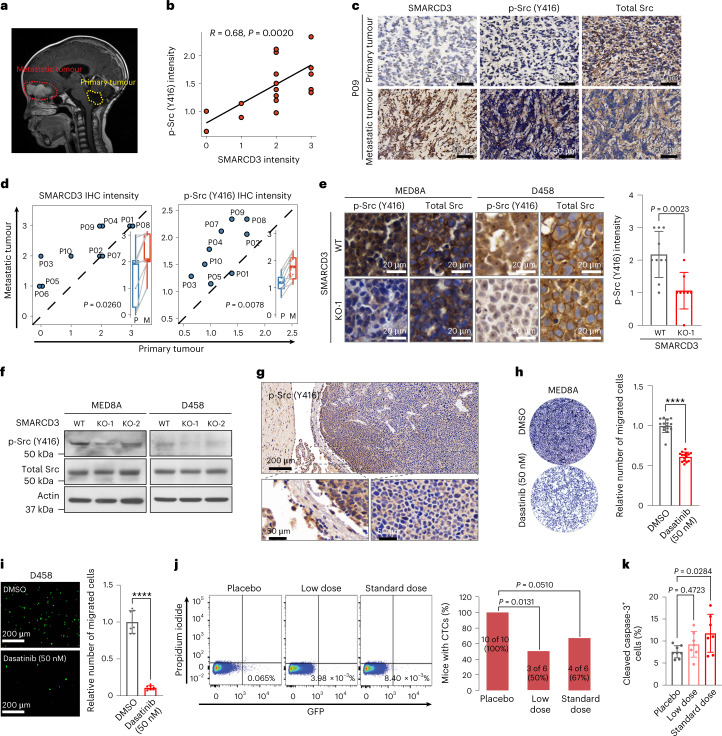
Fig. 7. Targeting SMARCD3–DAB1–Src activation attenuates MB metastatic dissemination.
a, Preoperative MRI sagittal image showing a patient with an enhancing metastatic tumour located at peritumoural brain oedema in the frontal lobe (red dashed line) and complete resection of the primary tumour in the cerebellum (yellow dashed line). b, Scatterplot showing the correlation between the IHC intensity of SMARCD3 and p-Src in MB tumours. c, Representative images of SMARCD3 and p-Src IHC staining in paired primary and metastatic MB samples from patient P09. d, Quantitative analyses of SMARCD3 and p-Src expression intensity in ten paired primary (P) and metastatic (M) MB samples. e, IHC (left) and quantitative analysis (right) of p-Src and total Src protein in tumours derived from mice bearing MED8A or D458 cells with SMARCD3 WT (n = 10) or KO (n = 8), respectively. f, IB for p-Src and total Src in MED8A and D458 cells with SMARCD3 WT or KO. g, Representative IHC images of p-Src in a MED8A-derived xenograft MB tumour. High-magnification images show the tumour margin and core areas. h,i, Representative images (left) and quantification (right) showing cell migration of MED8A (h; nDMSO = 15, nDasatinib = 15) and D458 (i; nDMSO = 7, nDasatinib = 8) cells treated with DMSO or 50 nM dasatinib in Transwell assays. j, Flow cytometry analyses (left) and quantification (right) of GFP+ CTCs from PBMCs of treated mice. k, IHC quantitative analysis of cleaved caspase-3 levels in tumours derived from the treated mice (nPlacebo = 8, nLow dose = 7, nStandard dose = 7). n represents the number of biologically independent samples (h,i) or mouse tissues (e,k). Data are presented as the mean ± s.d. P and R values were calculated using two-tailed Spearman’s rank correlation analysis (b), two-tailed paired t-test (d), one-tailed unpaired t-test (e,h,i), chi-square test (j) or one-way ANOVA with Dunnett’s multiple comparison test (k). ∗∗∗∗P < 0.0001. At least five replicates (f) or five mice (g) for each experiment were repeated independently, with similar results obtained.

