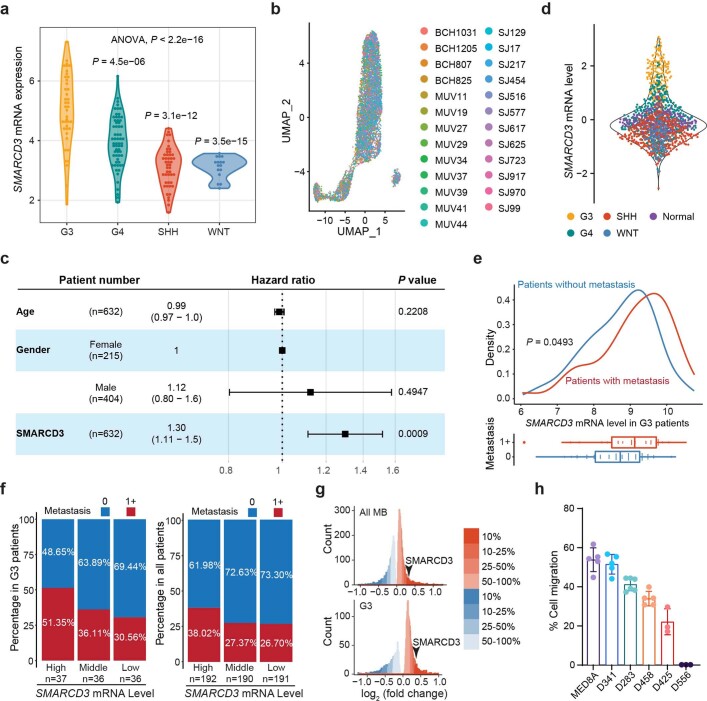
Extended Data Fig. 1. SMARCD3 expression and association with MB metastasis.
a, Violin plot showing expression levels of SMARCD3 mRNA in four MB subgroups in the RNAseq dataset (nG3 = 41, nG4 = 64, nSHH = 46, nWNT = 16). b, UMAP visualization of SMARCD3 expression in each cell in the scRNAseq data. c, Multivariable forest plot showing the significance of age, gender, and SMARCD3 mRNA expression level for overall survival in a multivariable model. d, Violin plot showing expression levels of SMARCD3 mRNA in four MB subgroups and normal cerebellum. e, Density plot and boxplot showing the association between metastasis status (0, no metastasis; 1 + , metastasis at diagnosis) and expression levels of SMARCD3 mRNA in primary G3 MB samples (n0 = 43, n1+ = 66) only. f, Bar diagrams showing the percentage of primary tumors without metastasis (0) or with metastasis (1 + ) in three groups with different expression levels of SMARCD3 mRNA (high, middle, low) in G3 MBs only and all subgroups of MBs, respectively. g, Histograms showing the number of differentially expressed genes between patients with metastasis and without metastasis by the log2(fold change). The arrows denote where SMARCD3 is located. h, Assessment of cell migration for 6 MB cell lines by Transwell assay (nMED8A = 5, nD341 = 5, nD283 = 6, nD458 = 5, nD425 = 3, nD556 = 3). One dot represents one cell (b), or one patient sample (a, d, e). n represents the number of human patients (a, e, f) or biologically independent samples (h). Data are presented as the mean ± s.d. (c, h). P values were calculated by two-tailed Welch’s t-test with FDR correction (a, e) or the two-tailed Wald test (c).

