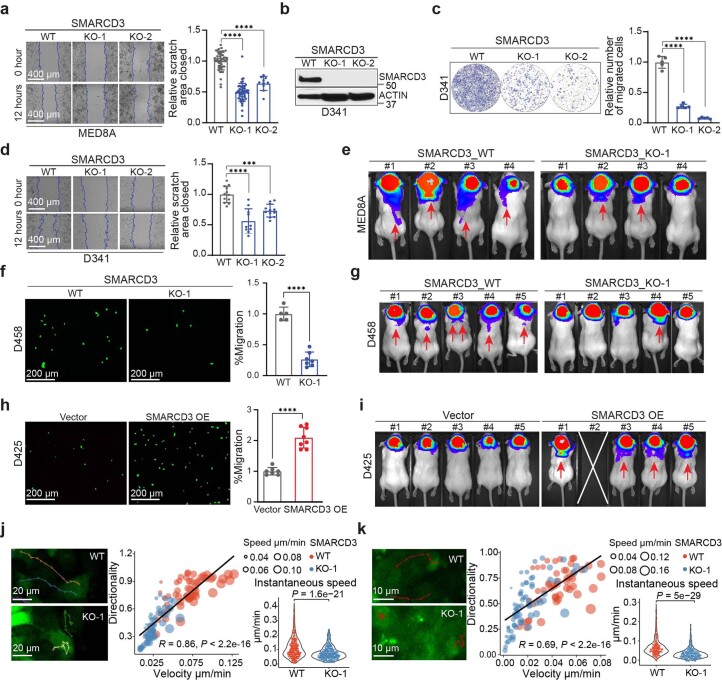
Extended Data Fig. 2. Altering SMARCD3 expression influences MB cell migration and metastatic dissemination.
Time-lapse images and quantification of cell migration of MED8A (a) with SMARCD3 WT (n = 52), KO-1 (n = 52), and KO-2 (n = 10); and D341 (d) with SMARCD3 WT (n = 12), KO-1 (n = 10), and KO-2 (n = 12) by scratch-wound healing assays. b, IB for SMARCD3 in D341 cells with control (WT) and SMARCD3 KO-1 and KO-2. Transwell images and quantification of cell recruitment in D341 (c) with SMARCD3 WT, KO-1, and KO-2 (n = 5 for each group); D458 (f) with SMARCD3 WT (n = 5) and KO-1 (n = 7); and D425 (h) with vector (n = 7) and SMARCD3 OE (n = 8). Bioluminescence images of mice bearing MED8A (e) and D458 (g) cells with SMARCD3 WT vs KO-1 at day 18 and endpoint after implantation respectively; and D425 cells (i) with vector and SMARCD3 OE at day 26 after implantation (one mouse died before imaging scan). Time-lapse imaging for MED8A cell migration with SMARCD3 WT vs KO-1 by scratch-wound healing (j) or ex vivo brain slice assays (k); the color lines show cell tracks; scatterplot shows the correlation between cell migration velocity and directionality; violin plot shows the instantaneous motility speed (one dot shows one cell at a one-time point). Each dot represents one cell and the dot size represents the average motility speed of one cell (scatterplots in j, k). n represents the number of the biologically independent samples from at least 2 independent experiments; data are presented as the mean ± s.d. (a, c, d, f, h). P and R values were calculated using one-way ANOVA with Dunnett’s multiple comparison test (a, c, d), one-tailed unpaired t-test (f, h), or two-tailed Welch’s t-test with FDR correction and two-tailed Pearson’s correlation analysis (j, k). ∗∗∗P = 0.0002, ∗∗∗∗P < 0.0001.

