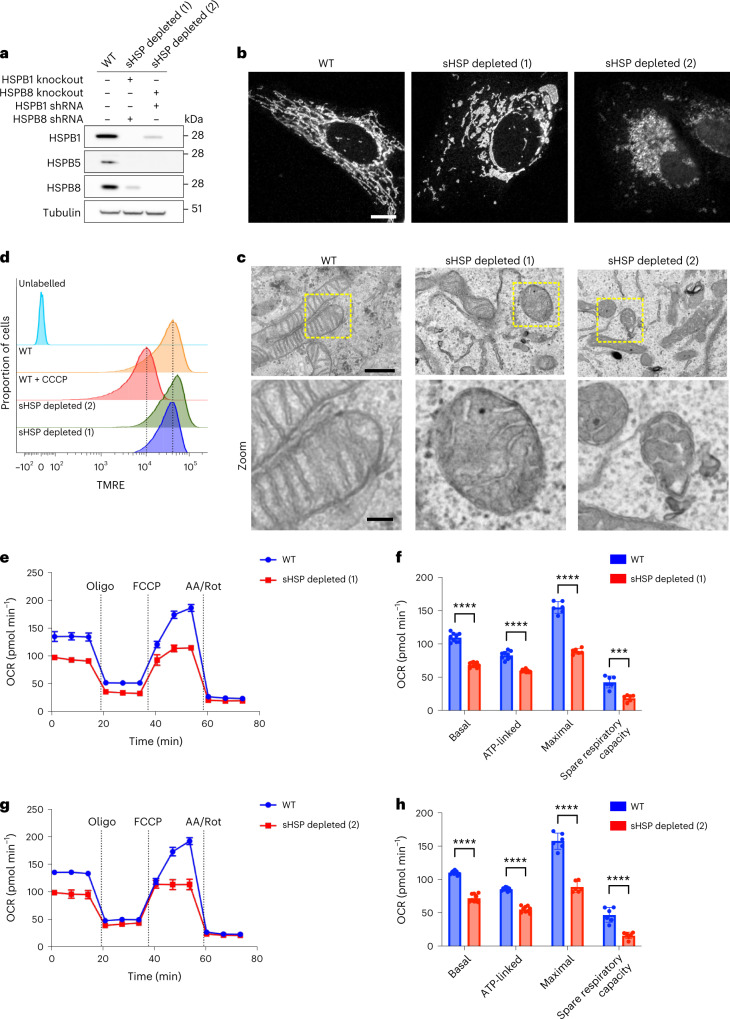
Fig. 3. Depletion of sHSPs disrupts mitochondrial morphology and function.
a, HeLa cells were depleted from sHSPs with a combination of CRISPR/Cas9 knockout and shRNA. Proteins were extracted and subjected to western blot. Immunoblotting shows the level of depletion for each of the respective sHSPs and tubulin is used as loading control. Note that we did not have to use HSPB5 shRNAs, as the HSPB5 expression decreased spontaneously in the absence of HSPB1 and HSPB8. b, The mitochondrial network of control and sHSP-depleted HeLa cells visualized by anti-TOM20 immunostaining and confocal microscopy. Representative cells are shown from more than three replicates. Scale bar, 10 μm. c, Mitochondrial ultrastructure of control and HSP-depleted HeLa cells visualized by transmission electron microscopy. Scale bar, 1.0 μm and 0.25 μm (zoom). d, Control or sHSP-depleted HeLa cells were incubated with TMRE for 30 min at 37 °C. After washing, the cells were collected and analysed by flow cytometry. Histograms representing TMRE signals for each of the respective cell lines are displayed. As a negative control, the membrane potential was dissipated by CCCP treatment. e–h, Mitochondrial respiration measurement with Seahorse. Oxygen consumption rates (OCR) were continuously measured in control and sHSP-depleted HeLa cells (e and g). Oligomycin (1 μM), FCCP (2 μM) and Antimycin A (AA, 0.5 μM)/Rotenone (Rot, 0.5 μM) were added at the indicated timepoints. Data are presented as mean ± s.d. (n = 3 biologically independent experiments). The parameters indicated in f and h were calculated from the measurement in e and g. Basal respiration, ATP-linked respiration, maximal OCR and spare respiratory capacity are presented as mean ± s.d. (n = 3 biologically independent experiments). Two-tailed unpaired Student’s t-tests were performed. ****P < 0.0001. Source numerical data, including exact P values, and unprocessed blots are available in source data.

