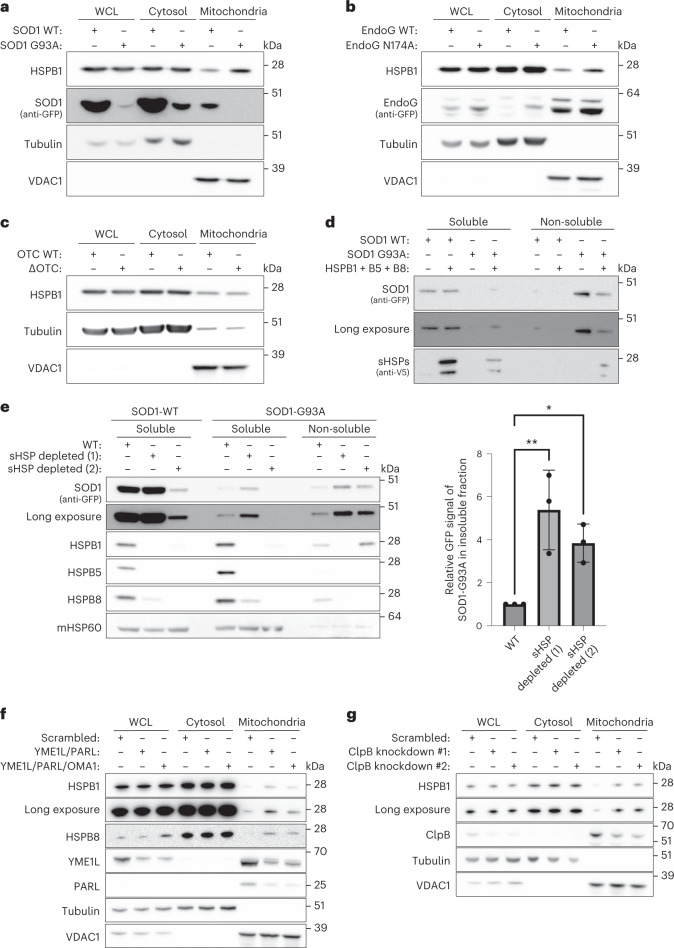
Fig. 4. sHSPs respond to the aggregation of client proteins in the mitochondrial IMS.
a–c, HeLa cells were transiently transfected with SOD1 wild-type (WT) or G93A (a), EndoG wild-type (WT) or N174A (b), OTC wild-type (WT) or delta-OTC (deleted 30–114 aa) (c). Samples were analysed by SDS–PAGE followed by immunoblotting using anti-HSPB1, anti-GFP (SOD1 or EndoG), anti-Tubulin (cytosolic marker) or anti-VDAC1 (mitochondrial marker) antibodies. Note that only the soluble fractions are displayed, and the reduced signal for SOD1-G93A is due to its insolubility. d, Cells were transfected as in a in wild-type or HSPB1/HSPB5/HSPB8-overexpressing HeLa cells. Isolated mitochondria were lysed in NP-40-containing lysis buffer, and the soluble fraction was separated from the non-soluble fraction by centrifugation. Samples were analysed by SDS–PAGE followed by immunoblotting using anti-V5 (for HSPB1/HSPB5/HSPB8) and anti-GFP (SOD1) antibodies. e, Protein aggregation assay in mitochondria isolated from transiently transfected HeLa cells with wild-type (WT) or G93A-mutant SOD1. Isolated mitochondria were lysed in NP-40-containing lysis buffer, and the soluble fraction was separated from the non-soluble fraction by centrifugation. Samples were analysed by SDS–PAGE followed by immunoblotting using anti-GFP (SOD1), anti-HSPB1, anti-HSPB5, anti-HSPB8 and anti-mHSP60 (marker for soluble mitochondrial fraction) antibodies. The amount of insoluble SOD1 was quantified using the anti-GFP signal from the non-soluble fraction, and data are shown as mean ± s.d. from three independent experiments. One-way ANOVA with Dunnett’s multiple comparisons test was performed. *P < 0.05, **P < 0.005. f, HeLa cells were depleted from YME1L, PARL and OMA1 with shRNA. Mitochondria were isolated and compared with the cytosolic or the NP-40-soluble WCL fraction. Samples were analysed by SDS–PAGE followed by immunoblotting using anti-HSPB1, anti-HSPB8, anti-YME1L, anti-PARL, anti-Tubulin (cytosolic marker) or anti-VDAC1 (mitochondrial marker) antibodies. g, HeLa cells were depleted from ClpB with two different shRNA. Mitochondria were isolated and compared with the cytosolic or the NP-40-soluble WCL fraction. Samples were analysed by SDS–PAGE followed by immunoblotting using anti-HSPB1, anti-ClpB, anti-Tubulin (cytosolic marker) or anti-VDAC1 (mitochondrial marker) antibodies. Results are representative of two (d, f and g) or three replicates (a, b, c and e). Source numerical data, including exact P values, and unprocessed blots are available in source data.

