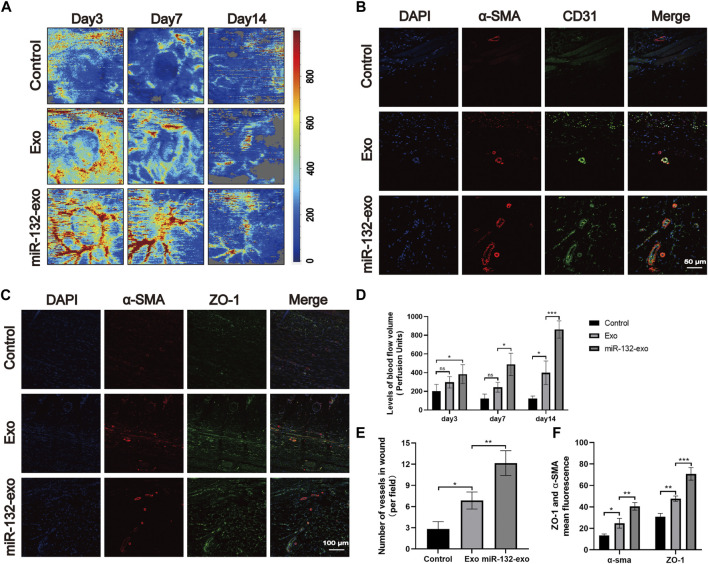
FIGURE 9.
The miR-132-exo promoted angiogenesis and vascular network formation in diabetic wounds. (A) Representative laser Doppler images on postsurgery day 3, 7, and 14; (B) Representative co-staining images of α-SMA and CD31 positive microvessels in each group on day 14, scale bar = 50 μm; (C) Representative immunofluorescence staining images of ZO-1 (red) and α-SMA (green) co-staining in each group on day 14, scale bar = 100 μm; (D) Quantitative data of signal intensity of blood flow in diabetic wounds in each group; (E) Quantification of newly formed vessels per field corresponding to co-staining of α-SMA and CD31; (F) Quantification of mean fluorescence intensity per field corresponding to co-staining of ZO-1 and α-SMA. *p < 0.05, **p < 0.01, ***p < 0.001, data are presented as the mean ± SD, n = 3.

