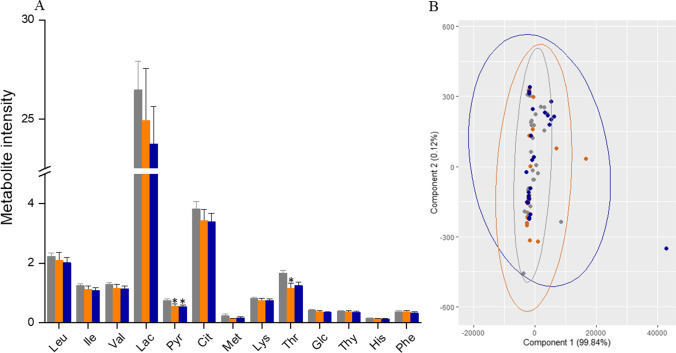
Fig. 2.
A Comparison of the metabolite levels in spent culture medium (SCM) samples from successfully implanted embryos (n=23) and embryos that failed to implant (n=33) relative to the levels in the medium control samples (n=44). B) Principal component analysis (bi-plot) of the region-wise integrals of the three groups. Gray
 represents medium control, orange
 represents SCM from successfully implanted embryos, and blue
 represents SCM from embryos that failed to implant

