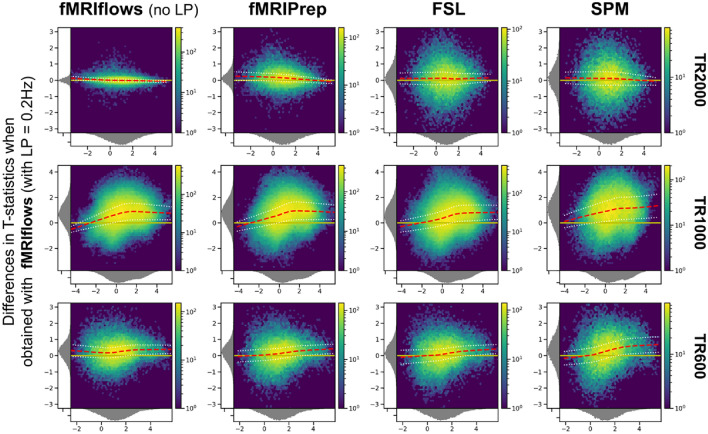
Fig. 12.
Bland–Altman 2D histograms of three different datasets, comparing unthresholded group-level T-statistic maps between multiple processing approaches. Datasets TR2000 (top), TR1000 (middle) and TR600 (bottom) were used for the comparison. Density plots show the relationship between average T-statistic value (horizontal) and difference of T-statistic values (vertical) at corresponding voxels for different pairwise combinations of toolboxes. The difference of T-statistics was always computed in contrast to a preprocessing with fMRIflows using a low-pass filter at 0.2 Hz, while the average T-statistics in horizontal direction investigated the preprocessing with (from left to right) fMRIflows without a low-pass filter, fMRIPrep, FSL and SPM. Distribution plots next to x- and y-axis depict occurrence of a given value in this domain. Color code within the figure indicates the number of voxels at this given overlap, from a few (blue) to many (yellow). Yellow horizontal line at zero indicates no value differences between corresponding voxels. Red dashed line depicts horizontal density average (Color figure online)

