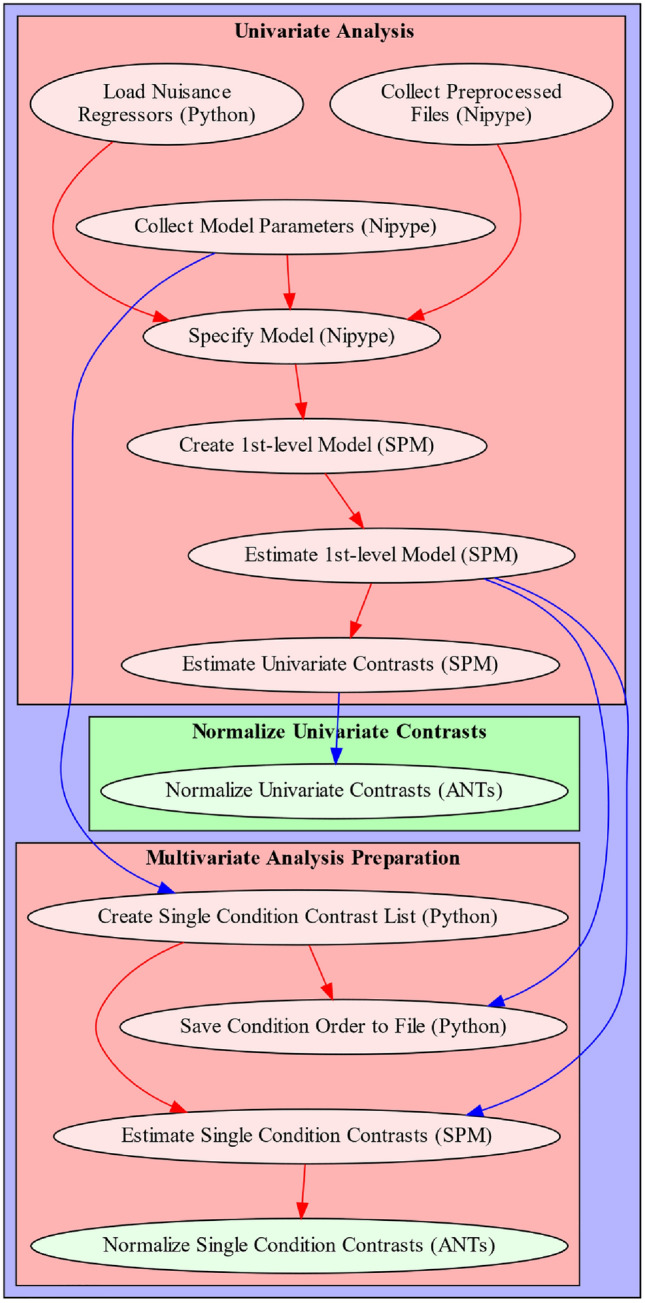
Fig. 3.

Depiction of fMRIflows’ 1st-level analysis pipeline. Arrows indicate dependency between the different processing steps and data flow. Name of each node describes functionality, with the corresponding software dependency mentioned in brackets. Sections that can be grouped into specific sections are contained within a red box to facilitate understanding of the pipeline. Color of arrows indicated if connection stays within a section (red) or not (blue). Nodes depicted in green are optional and can be run if spatial normalization was not yet performed during preprocessing (Color figure online)
