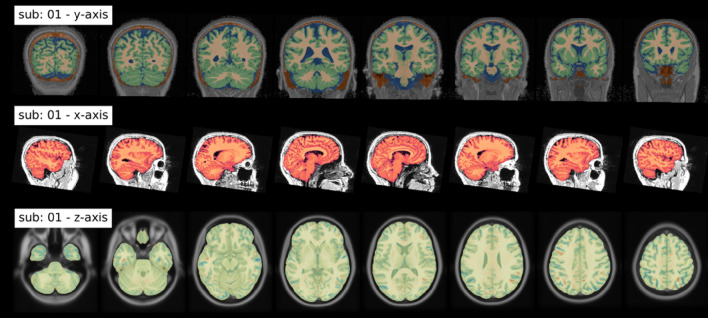
Fig. 4.
Summary of output figures generated by fMRIflows after executing the anatomical preprocessing pipeline. (Top) coronal view of the image segmentation output, showing gray matter tissue in green, white matter tissue in beige, cerebrospinal fluid in blue. (Middle) sagittal view of the brain extraction output, showing the extracted brain image in red, and the original anatomical image in gray. (Bottom) axial view of the spatial normalization output, showing the normalized brain image highlighted in yellow, overlaid over the ICBM 2009c brain template in gray. Regions in red and blue show negative and positive deformation discrepancy between the normalized subject image and the template (Color figure online)

