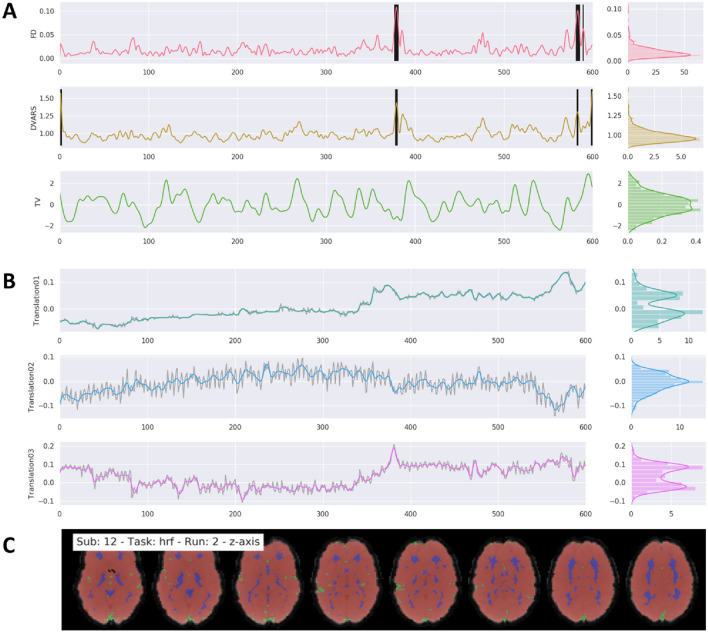
Fig. 5.
Example of general output figures generated by fMRIflows after executing the functional preprocessing pipeline. The dataset used to generate these figures was recorded with a TR of 600 ms and had a total of 600 volumes per run. Preprocessing included a low-pass filter at 0.2 Hz. Distribution plots on the right side of the figures in part A and B represent value frequency in y-direction. A Depiction of the nuisance confounds FD, DVARS and TV. Detected outlier volumes are highlighted with vertical black bars. B Estimation of translation head motion after application of low-pass filtering at 0.2 Hz in color, and before temporal filtering in light gray. C Depiction of brain masks used to compute DVARS (red), and temporal (green) and anatomical (blue) CompCor confounds, overlaid on the mean functional image (grey) (Color figure online)

