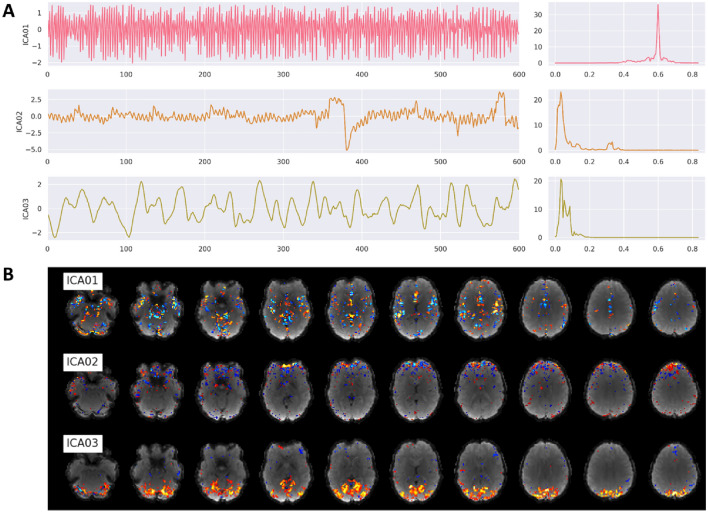
Fig. 6.
Example of ICA output figures generated by fMRIflows after executing the functional preprocessing pipeline. The dataset used to generate these figures was recorded with a TR of 600 ms and had a total of 600 volumes per run. A Correlation between the first three ICA components and the functional image over time (left) and the corresponding power density spectrum with frequency on the x-axis (right). First component most likely depicts respiration at 0.6 Hz, while third component is most likely visual activation induced by the visual stimulation task during data acquisition. B Correlation strength between a given ICA component and the location in the brain volume for the first three ICA components

