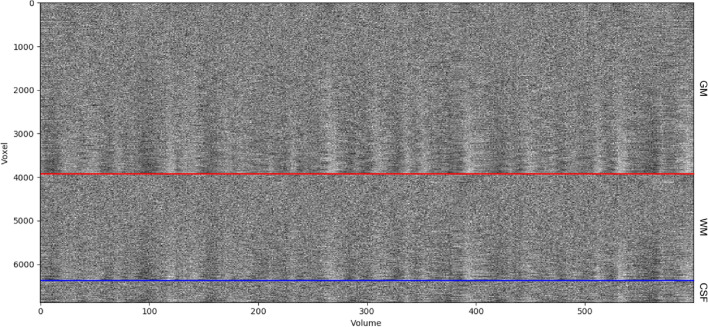
Fig. 7.
Example of a carpet plot figure generated by fMRIflows after executing the functional preprocessing pipeline. The dataset used to generate this figure was recorded with a TR of 600 ms and had a total of 600 volumes per run. This panel shows the signal after preprocessing for every other voxel (y-axis), over time in volumes (x-axis). The panel shows voxels in the gray matter (top part), white matter (between blue and red line) and CSF (bottom section). The data was standardized to the average signal, and ordered within a given region according to the correlation coefficient between a voxel and to the average signal of this region

