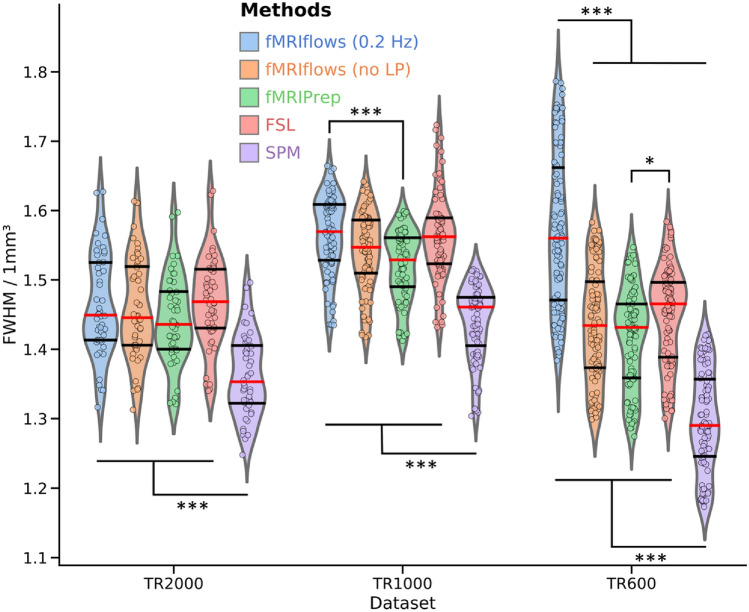
Fig. 8.
Investigation of estimated spatial smoothness after functional preprocessing of three different datasets, processed with varying approaches. The five different preprocessing approaches fMRIflows with (blue) and without (orange) a low-pass filter at 0.2 Hz, fMRIPrep (green), FSL (red) and SPM (violet) are plotted separately for the dataset TR2000 (left), TR1000 (middle) and TR600 (right). The violin plots indicate the overall distribution of the normalized smoothness estimates of each functional image (depicted in individual dots: TR2000 = 48 dots, TR1000 = 80 dots, TR600 = 102 dots). The red horizontal line represents the median value, while the horizontal black lines indicate the 25 and 75 percentiles of the value distribution respectively. Two-sided t-test were computed for each pair of approaches used and each dataset. Significant differences between groups are indicated with *p < 0.05 and ***p < 0.001. All results are corrected with the Tukey multiple comparison test (Color figure online)

