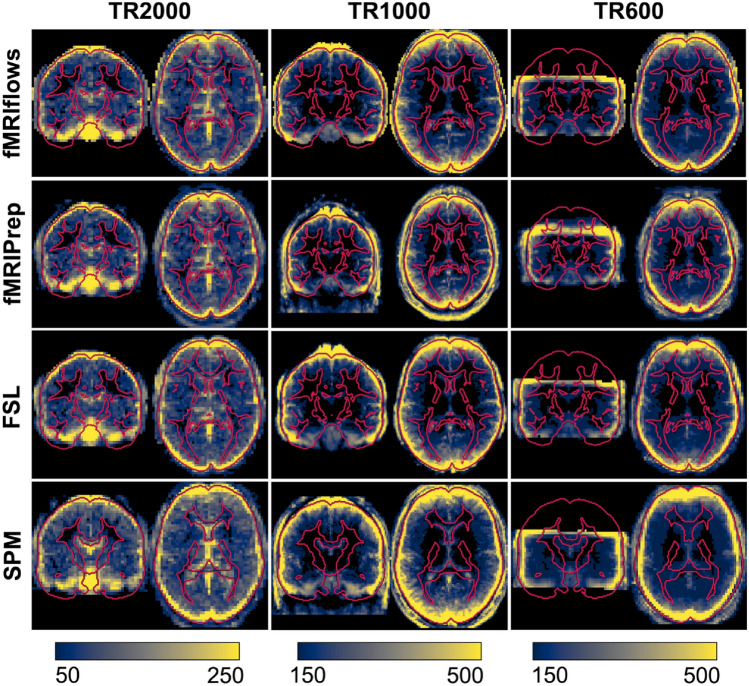
Fig. 9.
Depiction of standard deviation maps of the temporal averages of three different datasets, after multiple functional preprocessing approaches. Preprocessing was done with fMRIflows (with a temporal low-pass filter at 0.2 Hz; without low-pass filter looks identical), fMRIPrep, FSL and SPM (from top to bottom) separated for the TR2000 (left), TR1000 (middle) and TR600 (right) dataset. Color value represents the standard deviation value over all subjects. Color scale is the same within a dataset and was set manually to highlight the border effects in gray matter regions. Regions with high inter-subject variability are shown in yellow, while regions with low inter-subject variability are shown in blue. Outline of the brain and subcortical white matter regions is delineated in red and is based on the ICBM 2009c brain template, except for the analysis with SPM where it is based on SPM’s tissue probability map template (Color figure online)

