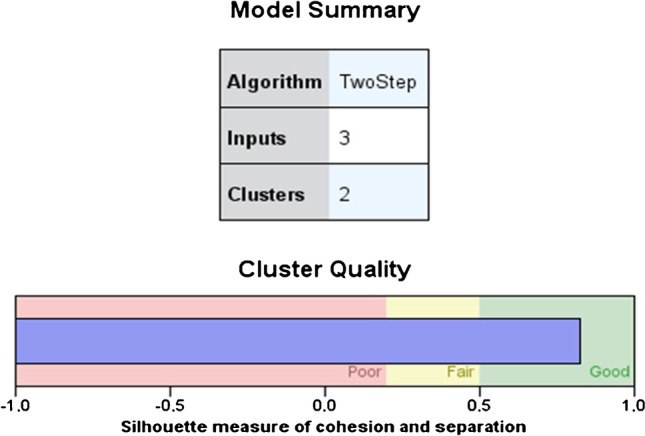
Fig. 6.

Summary and quality of the cluster analysis model. A silhouette measure of cohesion and separation coefficient of 1 means that all cases are in their cluster centres. A value of − 1 means that all cases are in the centers of other clusters to which they do not belong. A value of 0 means that, on average, the cases are equidistant between the center of their own conglomerate and the center of another nearby conglomerate. Therefore, a result in the “Good” zone means that the data strongly evidence the structure of the conglomerates. A result in the “Sufficient” area means that the data show this cluster structure in a less evident way, and a result in the “Poor” area reflects that the data does not provide significant evidence of the cluster structure
