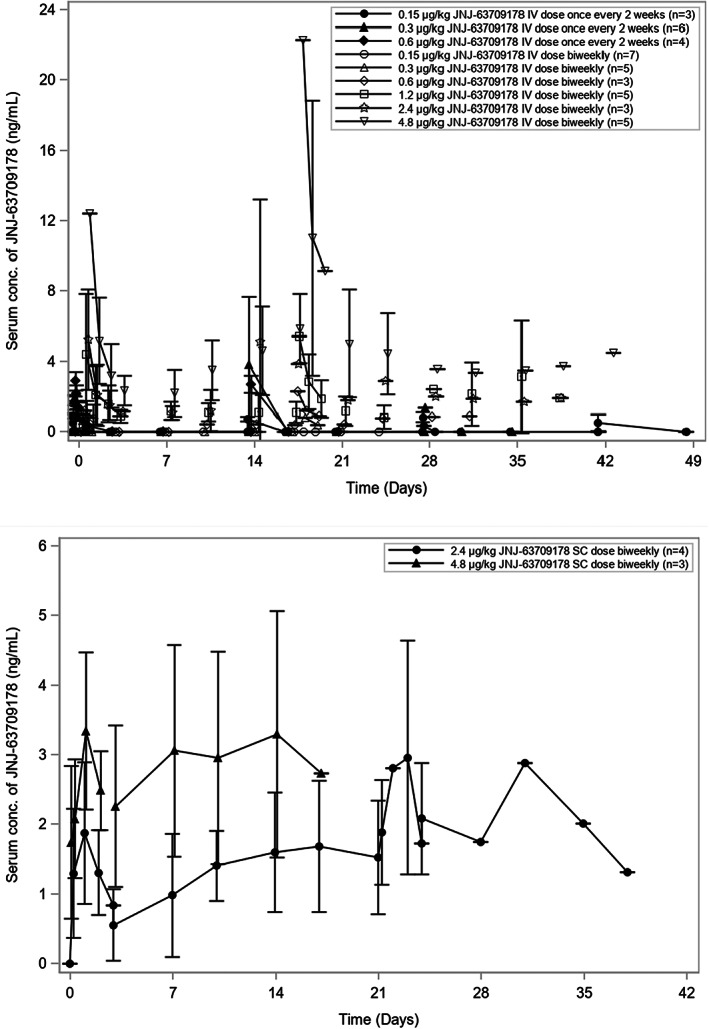
FIGURE 1.

Mean serum concentration‐time curves of JNJ‐63709178. (a) Mean serum concentration following i.v. administration. The i.v. doses of JNJ‐63709178 were administered once every 2 weeks for cohort 3 (0.15 μg/kg), cohort 4 (0.30 μg/kg), and cohort 5 (0.6 μg/kg after priming dose of 0.3 μg/kg). Doses were administered twice weekly for cohort 6 (0.15 μg/kg after 4 priming doses of 0.15 μg/kg), cohort 7 (0.3 μg/kg after 4 priming doses of 0.15 μg/kg), cohort 8 (0.6 μg/kg after 4 priming doses of 0.15/0.30 μg/kg), cohort 9 (1.2 μg/kg after priming doses of 0.15, 0.3 and 0.6 μg/kg), cohort 10 (2.4 μg/kg after priming doses of 0.15, 0.3, 0.6, 1.2 μg/kg), and cohort 11 (4.8 μg/kg after priming doses of 0.15, 0.3, 0.6, 1.2 μg/kg and, if applicable, 2.4 μg/kg). Serum concentrations of JNJ‐63709178 were measured by an electrochemiluminescence‐based immunoassay. (b) Mean serum concentration following s.c. administration. The s.c. doses of JNJ‐63709178 were administered twice weekly for s.c. cohort 1 (2.4 μg/kg after priming doses of 0.3, 0.6, 1.2 μg/kg) and s.c. cohort 2 (4.8 μg/kg after priming doses of 0.6, 1.2, 2.4 μg/kg). Serum concentrations of JNJ‐63709178 were measured by an electrochemiluminescence‐based immunoassay. Mean concentration values are connected with lines from dose groups with at least three patients with samples taken at the specified times post dose. When mean concentrations fell below the limit of quantitation the dots could not be connected. Error bars = SD.
