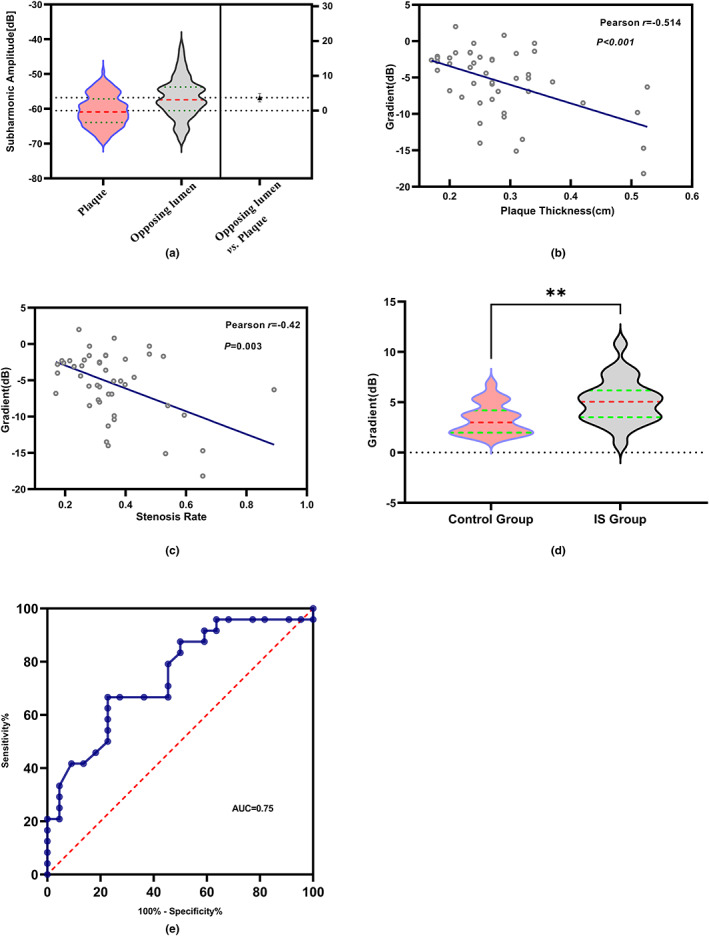
FIGURE 3.

Statistical analysis of SHAPE US parameters. (a) Comparison of subharmonic amplitude of plaque and opposing lumen by independent sample t‐tests; p value less than 0.001. (b) Correlation between the subharmonic gradient across the plaque cap and thickness in the narrowest lumen. (c) Correlation between lumen stenosis severity and the subharmonic gradient across the plaque cap in the narrowest lumen. (d) The subharmonic gradient of intraplaque of the IS group and control group; **, p value = 0.0038. (e) Receiver operating characteristic curves demonstrate ability to use subharmonic‐aided pressure estimation (SHAPE) to identify patients with IS. AUC, area under receiver operating characteristic curve = 0.75; IS, ischemic stroke; SHAPE, Subharmonic Aided Pressure Estimation; US, ultrasound.
