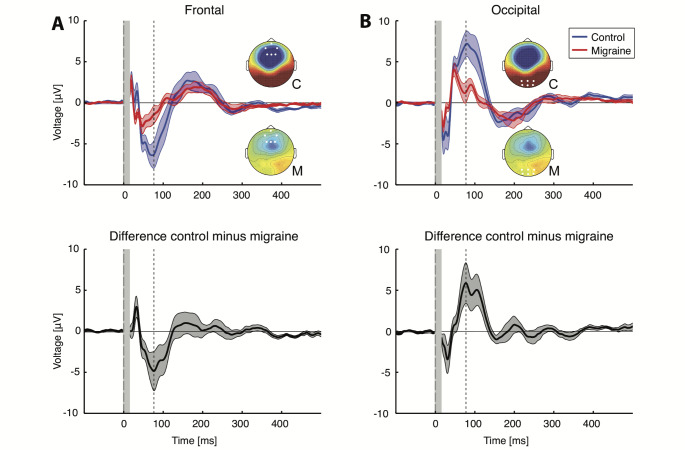
Fig. 4.
Grand-averaged TEP responses and difference waveform (control minus migraine) at frontal (F1, F2, Fz, Fpz, AF4, AF3) and occipital (Oz, O1, O2, POz, PO3 and PO4) electrodes show differences in TEP peaks between controls and migraine subjects. Two separate components of a negative waveform cluster were found using exact cluster-based permutation testing (enumeration). (a) Migraine group (red line) shows decreased frontal activity around the TEP N100 peak compared to control group (blue line), with largest difference of -4.9 µV at 77 ms after stimulation (dashed line). Bottom plot shows the difference between migraine and control groups (standard error of the mean calculated using 10.000 bootstraps over both groups). (b) Occipitally, the TEP N100 peak decreased as well in migraine, with largest difference of -5.9 µV at 78 ms after stimulation (dashed line). Bottom plot shows the difference between migraine and control groups. Insets show topographical distribution in control (C) and migraine (M) at the time point of maximal difference with electrodes highlighted in white dots. Traces show grand-averaged mean with patched standard error. The grey bars indicate the spherically interpolated parts of the EEG traces (-1 to 15 ms)

