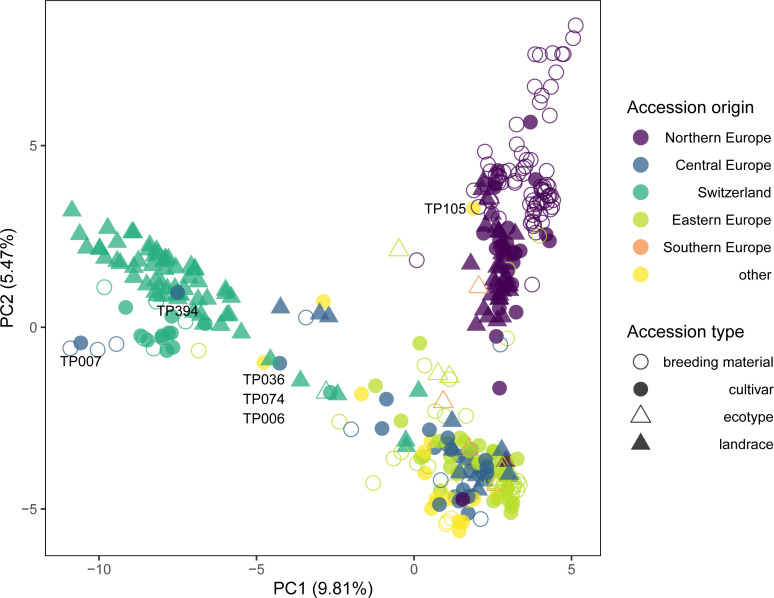
Figure 3.
Genetic similarity of 371 selected red clover accessions revealed by principal component analysis (PCA) of allele frequency data based on 20,137 SNP markers and pooled leaf samples of 200 individuals per accession. Accessions forming the three major clusters of the complete set identified by k-means clustering ( Figure 2 ) were selected. Colors indicate the region of origin of the accessions and symbols indicate the accession type. Accession IDs are given for selected accessions.

