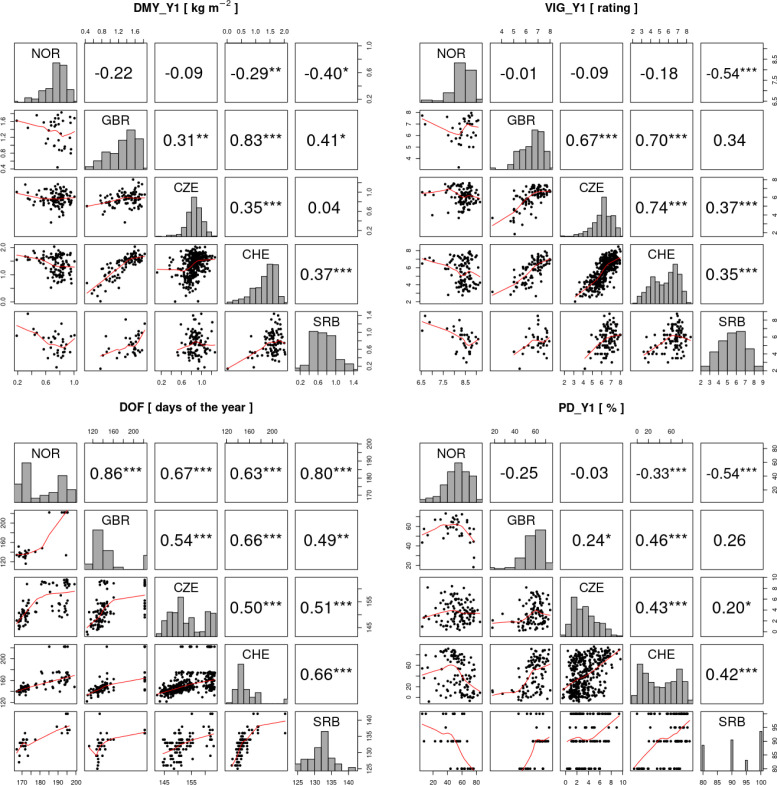
Figure 7.
Correlation analysis of the traits total dry matter yield in the first year (DMY_Y1), average vigor in the first year (VIG_Y1), date of flowering (DOF) and plant density after the first year (PD_Y1) in the five field trial locations. In the diagonal, histograms of the trait values for each trial location are shown. Above the diagonal, Pearson correlations between trials are shown and significant correlations are indicated by asterisks (*p< 0.05, ** p< 0.01, *** p< 0.001). Below the diagonal, trait values of the two trials are plotted against each other with the red line representing the LOESS (locally estimated scatterplot smoothing) line.

