Fig. 2.
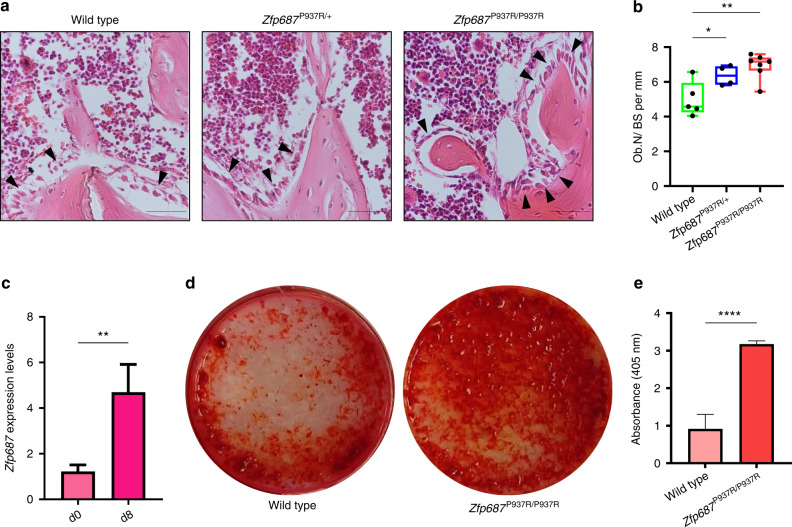
Zfp687P937R differentiated osteoblasts display an increased mineralization potential. a Representative H&E-stained images of proximal tibial sections analyzed for osteoblast (arrowheads) quantification in wild-type, Zfp687P937R/+, and Zfp687P937R/P937R mice at 3 months of age. Scale bars 50 µm. b Box plots showing histomorphometric quantification of the osteoblast number per bone surface ratio (Ob.N/BS) in wild-type (n = 5), Zfp687P937R/+ (n = 4), and Zfp687P937R/P937R (n = 7) mice at 3 months of age. Data are presented as the median ± s.d. Statistical significance was assessed by one-way ANOVA with Dunnett’s multiple comparison test (*P < 0.05; **P < 0.01). c Bar graph showing Zfp687 expression analysis in wild-type BM-MSCs either untreated (d0) or stimulated for 8 days toward osteoblastogenesis (d8). Data are presented as the mean ± s.d. Statistical significance was assessed by an unpaired t test (**P < 0.01, two-tailed). d Representative Alizarin Red Staining (ARS) images of wild-type and Zfp687P937R/P937R BM-MSCs after 8 days of osteogenic induction. e Bar graph showing ARS quantification of wild-type (n = 4) and Zfp687P937R/P937R (n = 4) osteoblast differentiation after 8 days of osteogenic induction. Data are presented as the mean ± s.d. Statistical significance was assessed by an unpaired t test (****P < 0.000 1, two-tailed)

