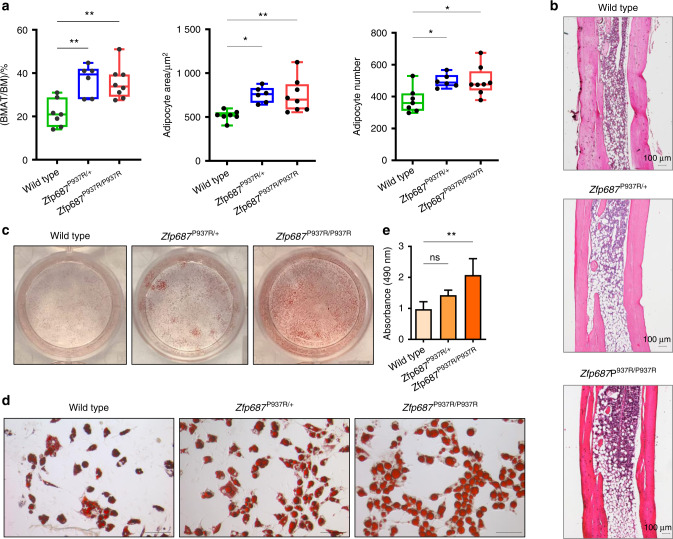
Fig. 3.
Zfp687 mutant mice display increased cBMAT composition at 3 months of age. a Box plots showing the quantification of the tibial cBMAT volume expressed as the percentage of BMAT to total bone marrow ratio (BMAT/BM; left), the adipocyte area (middle), and the adipocyte number (right) of wild-type (n = 7), Zfp687P937R/+ (n = 6), and Zfp687P937R/P937R (n = 8) mice at 3 months of age. Data are presented as the median ± s.d. Statistical significance was assessed by one-way ANOVA with Dunnett’s multiple comparison test (*P < 0.05; **P < 0.01). b Representative H&E-stained images of distal tibial sections analyzed for adipocyte measurements of the indicated genotypes. c, d Oil Red O (ORO) staining of wild-type, Zfp687P937R/+, and Zfp687P937R/P937R BM-MSCs upon adipogenic induction and differentiation (plate view in c) and 20X magnification in (d). Scale bars, 100 µm. e Bar graphs show the intensity of ORO staining (absorbance at 490 nm) of wild-type (n = 4), Zfp687P937R/+ (n = 5), and Zfp687P937R/P937R (n = 6) adipocytes. Data are presented as the mean ± s.d. Statistical significance was assessed by one-way ANOVA with Dunnett’s multiple comparison test (**P < 0.01)

