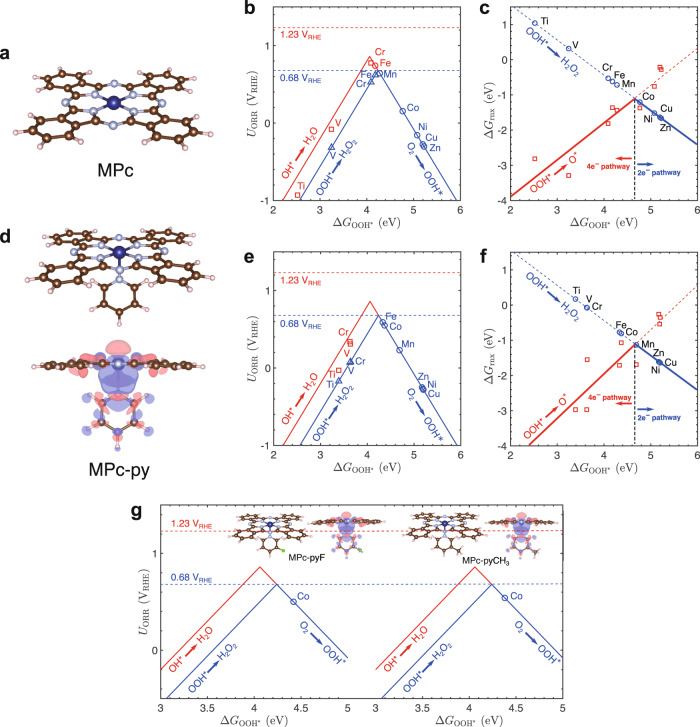
Fig. 1. Theoretical predictions of ORR activity and selectivity on various MPc and HSACs based on MPc (M = Ti, V, Cr, Mn, Fe, Co, Ni, Cu, Zn).
a Typical atomic structure of MPc (color code: dark blue, metal ion; red, O; light blue, N; brown, C; light pink, H). b Calculated catalytic activity volcano plot for the 2e− and 4e− reaction pathways of ORR over MPc. c Calculated selectivity plot of ORR over MPc. d Typical atomic structure of M HSACs (color code: dark blue, metal ion; red, O; light blue, N; brown, C; light pink, H). The isosurface plot shows the charge redistribution upon pyridine ligand linkage to CoPc. The isosurface level is set to 5 × 10⁻⁴ e/bohr3. Red and blue colors represent the electron accumulation and depletion, respectively. e Calculated catalytic activity volcano plot for the 2e− and 4e− reaction pathways of ORR over M HSACs. f Calculated selectivity plot of ORR over M HSACs. g Calculated catalytic activity volcano plot for the 2e− and 4e− reaction pathways of ORR over Co HSACs-F and Co HSACs-CH3. The atomic structures of typical Co HSACs-F and Co HSACs-CH3 are shown in the insets (color code: dark blue, metal ion; red, O; light blue, N; brown, C; light pink, H; green, F). The isosurface plot shows the charge redistribution upon py-F and py-CH3 linkage to CoPc. The isosurface level is set to 5 × 10⁻⁴ e/bohr3. Red and blue colors represent the electron accumulation and depletion, respectively. Source data are provided as a Source Data file.

