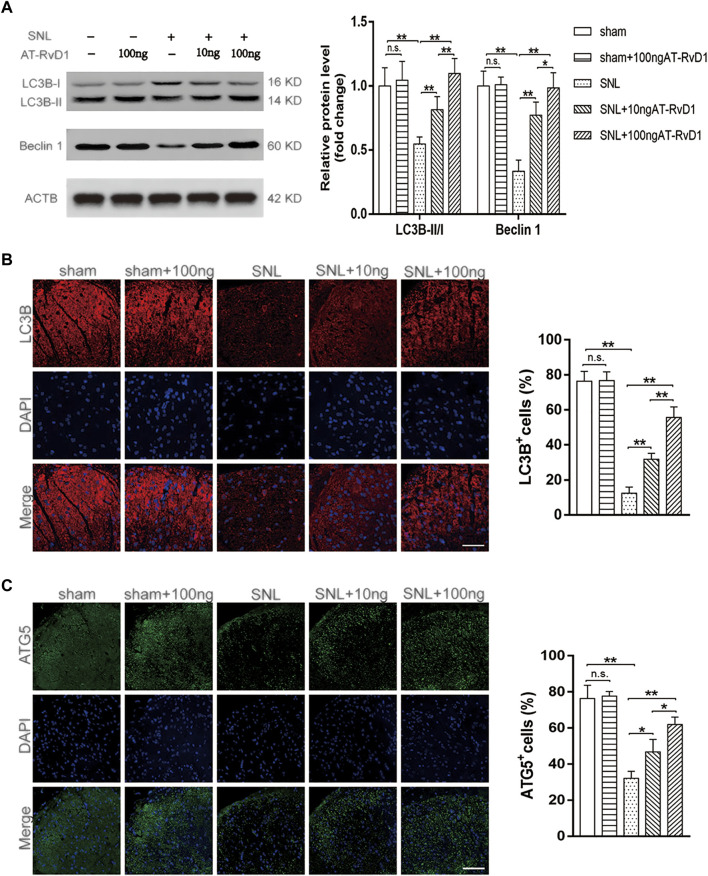
FIGURE 2.
Effect of administration of AT-RvD1 on activation of autophagy in a rat model of neuropathic pain (A) Representative photomicrographs of western blot bands and densitometric analysis for quantifying the expression of proteins Beclin1, LC3B-II, and LC3B-I in different groups (n = 5/group). (B) Immunostaining of LC3B puncta was visualized using fluorescence microscopy (n = 3/group) (scar bars = 60 µm for figures). (C) Immunostaining of ATG5 puncta was visualized using fluorescence microscopy (n = 3/group) (scar bars = 60 µm for figures). Data were expressed as mean ± standard error of mean (SEM). ∗p < .05. ∗∗p < .01. n. s. means no significant difference between independent experiments.

