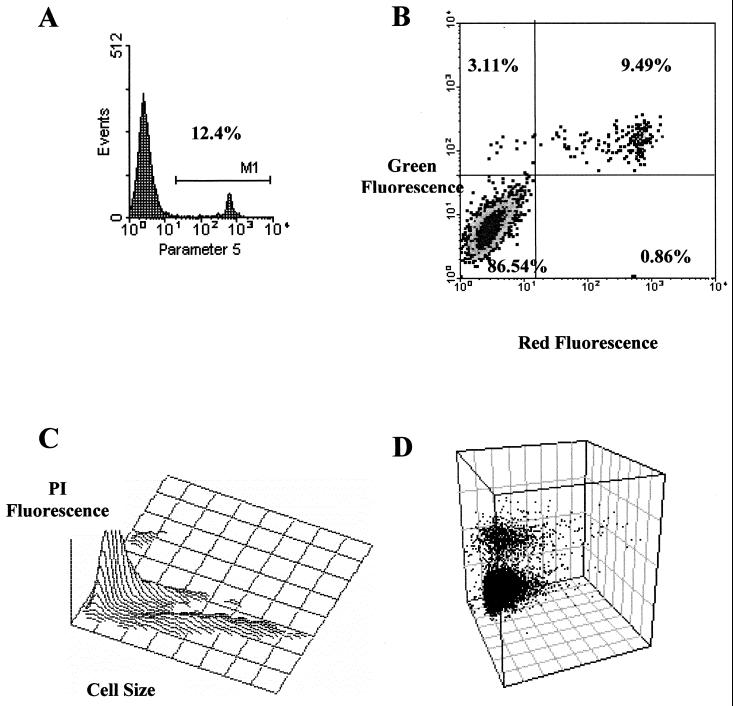
FIG. 3.
The data obtained from a flow cytometer can be displayed in several ways. The most common are the mono- and biparametric histograms (A and B), which usually include a statistical analysis of the results. (A) Monoparametric histogram showing the selected parameter on the x axis and the relative cell number on the y axis. (B) Biparametric histogram showing cells distributed as a function of their signal intensity with respect to each parameter. Cells located in the upper left quadrant are positive for the parameter represented on the y axis, cells located in the upper right quadrant are positive for both parameters, cells located in the lower left quadrant are double negative, while cells in the lower right panel are positive for the parameters on the x axis. (C and D) Three-dimensional representations. The z axis can represent the relative number of cells (C) or a third parameter (D), such as scattered light on the x and y axes and fluorescence signals on the z axis.

