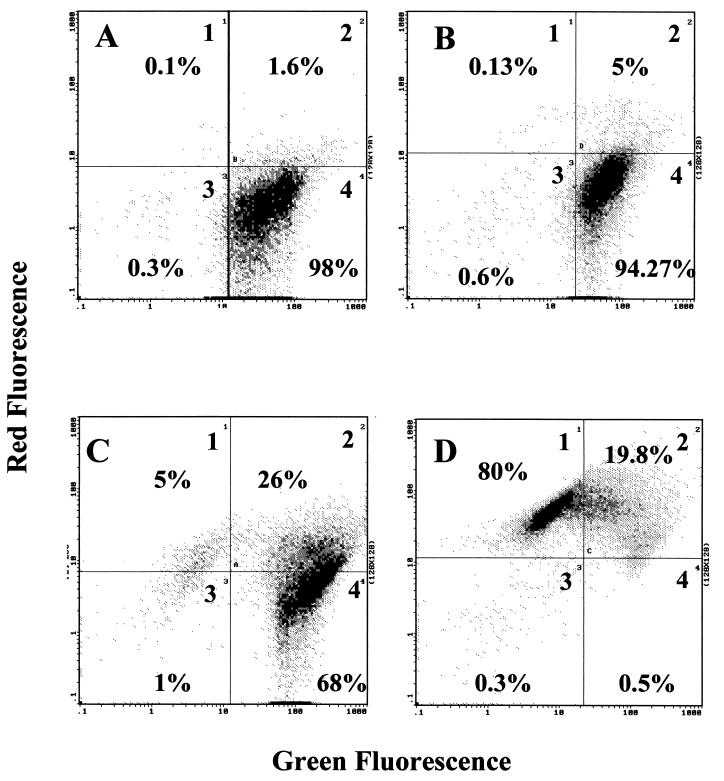
FIG. 5.
Antimicrobial susceptibility testing by FCM using the Bac/live kit (Molecular Probes). Antimicrobial susceptibility is shown by the decrease in green fluorescence (live cells) and the increase in red fluorescence (dead cells). (A) Distribution of E. coli cultures without antimicrobial agent incubation; therefore, the cells appear mainly in quadrant 4 (positive for green fluorescence). (B) An E. coli culture was incubated for 2 h with vancomycin at 1.024 g/ml. The distribution is similar to that seen in panel A. Accordingly, this strain was not affected by antimicrobial agent treatment, although a small percentage of cells was positive for the red fluorescence, meaning that the cells were sensitive to vancomycin. The same protocol was applied to E. faecium (C) and E. faecalis (D) cultures. As described in the text, E. faecium is vancomycin resistant and E. faecalis is vancomycin sensitive. (C) One subpopulation of E. faecium lies in quadrant 1 (positive for red fluorescence only), another is in quadrant 2 (positive for red and green fluorescence), and the majority is in quadrant 4 (positive for green fluorescence only). This means that the behavior of the E. faecium population is not homogeneous in the presence of vancomycin, perhaps due to the loss of the element responsible for vancomycin resistance. (D) After 2 h of incubation, most E. faecalis cells appear in quadrant 1 and the rest appear in quadrant 2. Therefore, almost all cells are positive for red fluorescence and are dead. However, a small population (0.5%) is still present in quadrant 4, meaning that this population is less sensitive to vancomycin than the rest (over 99% of the cells).

