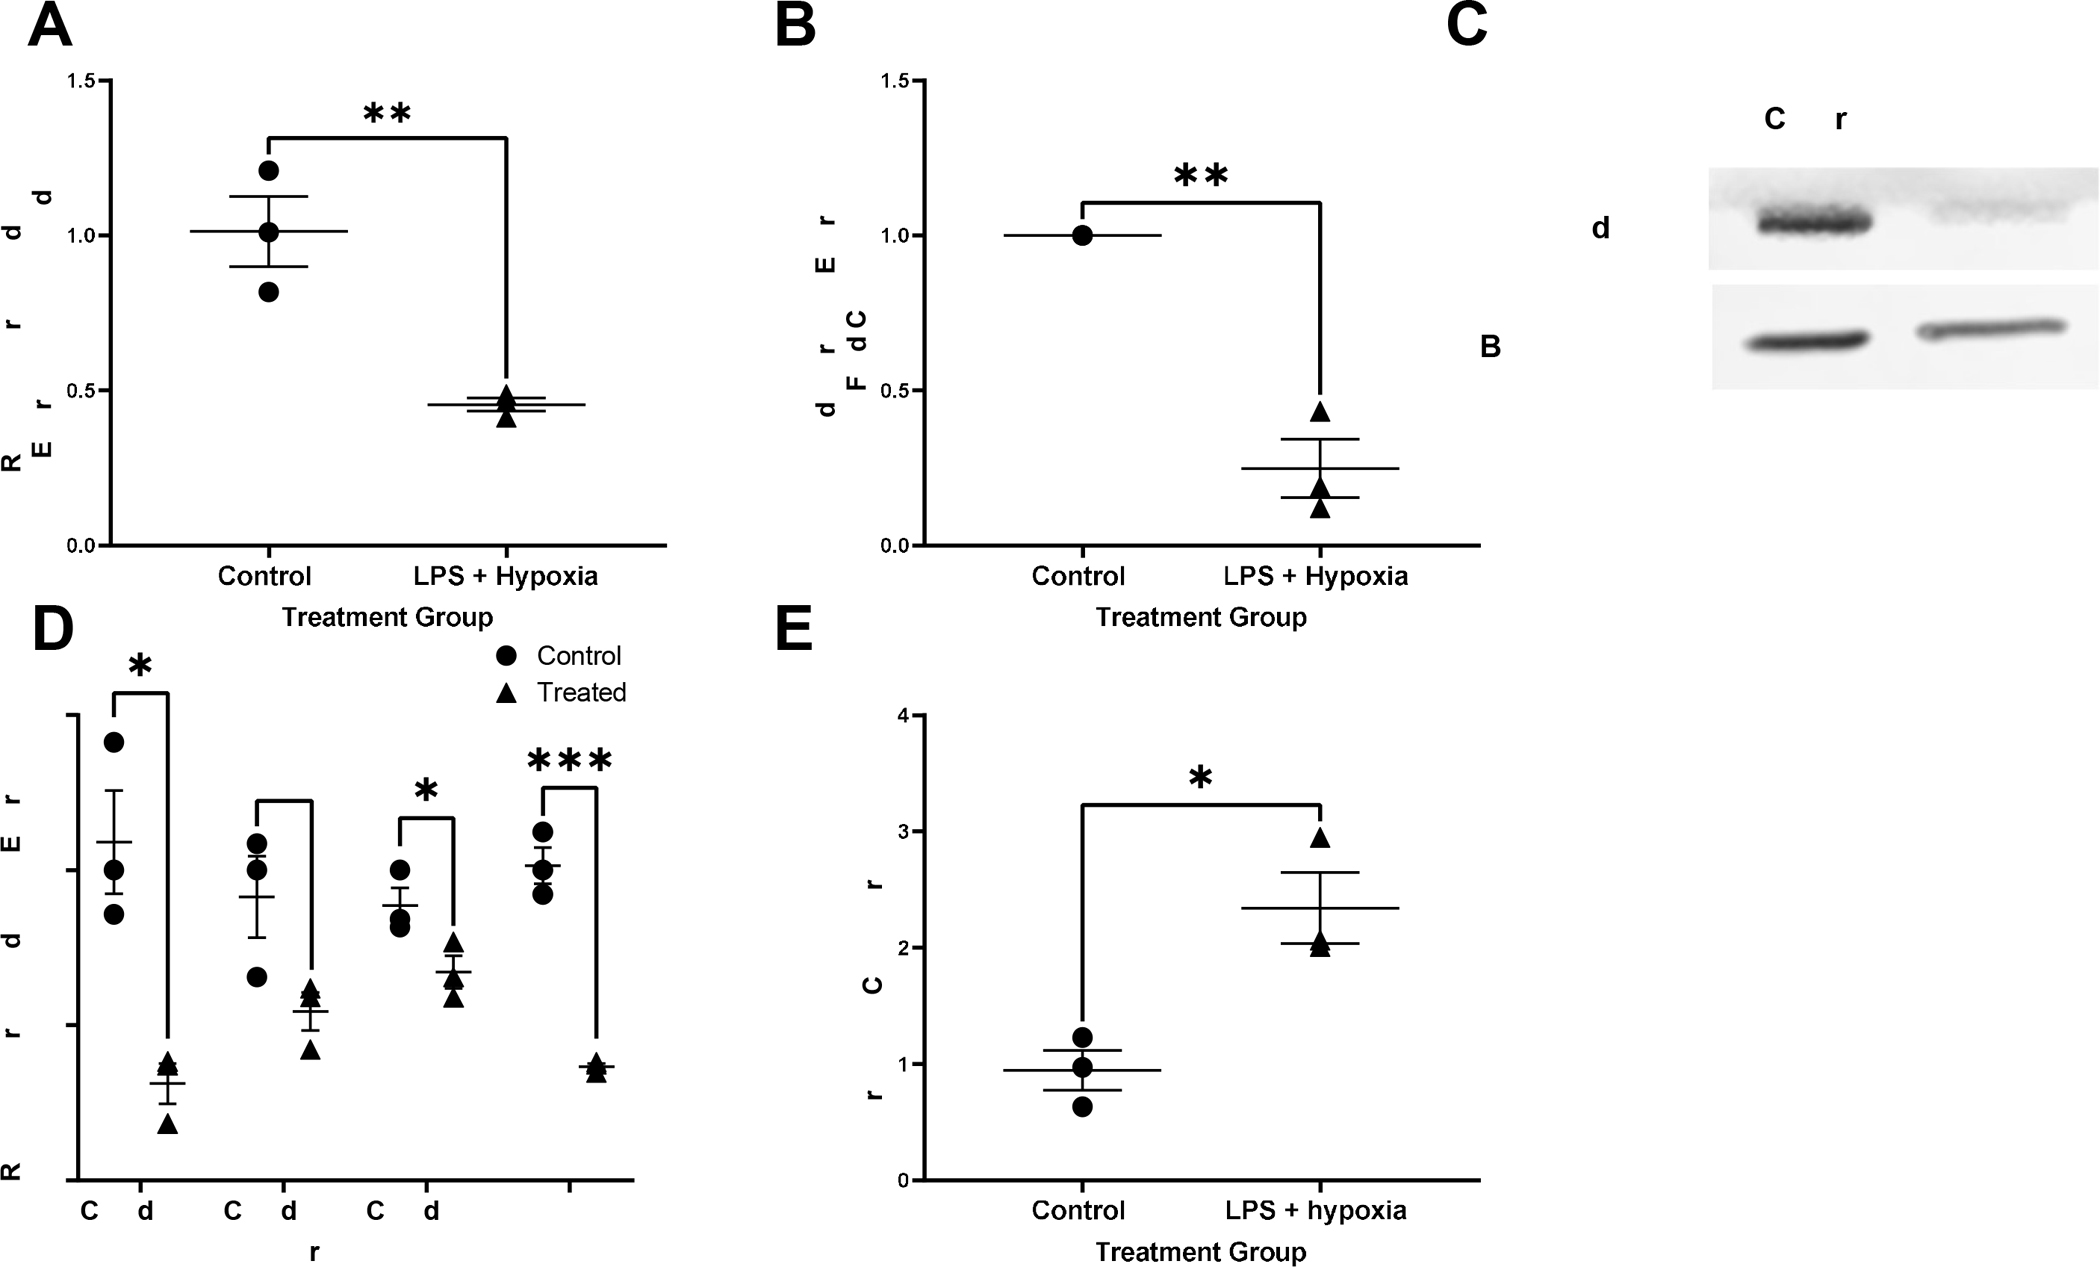
Figure 6.

Relative gene expression of occludin normalized to GAPDH in control vs treated apical-out (AO) enteroids, **p=0.008, n=3 in each treatment group (A). Expression of the protein occludin relative to untreated control and normalized to beta-actin in control vs treated AO enteroids, *p=0.001, n=3 in each treatment group (B). Representative western blot of occludin and beta-actin in AO control versus treated enteroids (C). Relative gene expression of tight junction proteins claudins-1,3 and 4 as well as zonula occludens (ZO)-1 normalized to GAPDH in control vs treated AO enteroids, *p=0.01 for claudin-1, p=0.06 for claudin-3, *p=0.05 for claudin 4, ***p=0.0004 for ZO-1, n=3 in each treatment group (D). Increased permeability seen in treated AO enteroids compared to control demonstrated via Lucifer yellow assay, *p=0.02, n=3 in each treatment group (E).
