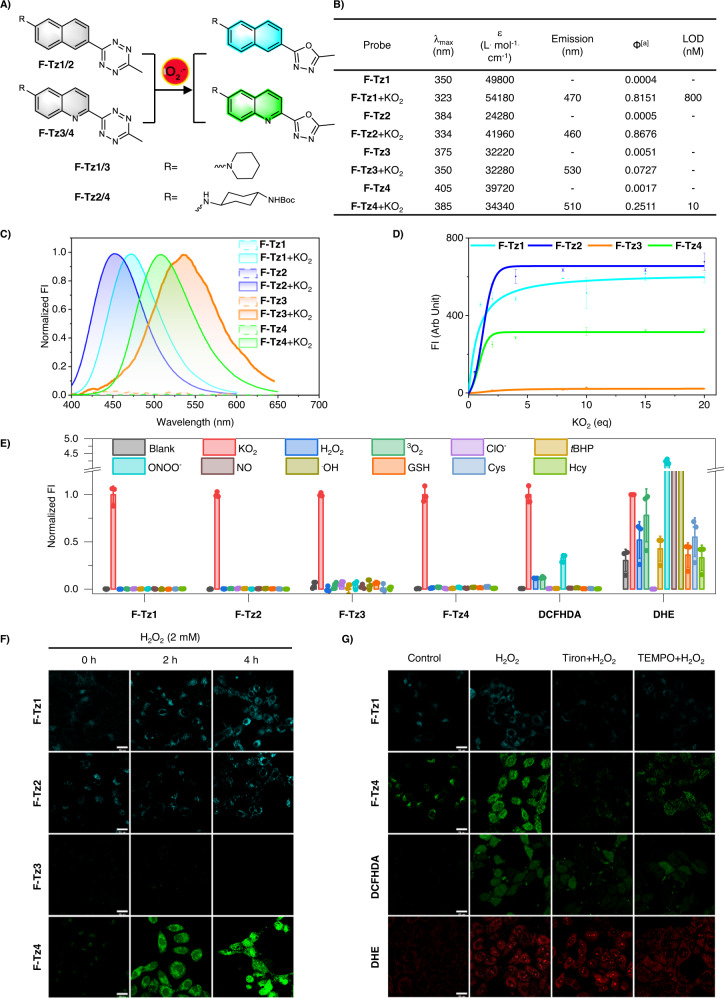
Fig. 2. Design of Tz-based fluorogenic probes for imaging superoxide in live cells.
A Structures of the probes and their sensing mechanism. B Photophysical properties of the probes before and after sensing superoxide. [a]Ф: Quantum yields were determined with quinine sulfate (Фstandard = 0.577 in 0.1 M H2SO4) as a standard (λex 365 nm). C Normalized emission spectra of the probes (5 μM) before and after the treatment of superoxide (20 eq). The data were normalized to the maximum emission after the treatment of superoxide. D Plot of probe (5 μM) fluorescence intensity at their peak emission wavelengths as a function of superoxide doses. Data are presented as mean value ± SD, n = 3 independent experiments. E Fluorescence response of the probes toward various reactive analytes in comparison to DCFHDA and DHE. All probes were used at 5 μM and the reactive analytes were used at 100 μM except ONOO− (10 μM) and NO (20 μM). The reactions were carried out in PBS (pH 7.4, 10 mM) at ambient temperature for 30 min before measurement. Data were the normalized emission intensities at their peak emission wavelengths. Data are presented as mean value ± SD, n = 3 independent experiments. F Confocal microscopy images of HepG2 cells pretreated with H2O2 (2 mM) for various durations and then stained with either the blue emissive F-Tz1 or F-Tz2, or green emissive F-Tz3 or F-Tz4. Probes were used at a final concentration of 5 μM and were incubated with the cells for 30 min before imaging. Representative images are shown from n = 3 independent experiments. G Fluorescence images of HepG2 cells stained with F-Tz1, F-Tz4, DCFHDA, or DHE (each 5 μM, 30 min). Before being stained with the probes, cells were intact (control), or pretreated with H2O2 (2 mM) for 2 h, or first pretreated with tiron (100 μM) or TEMPO (300 μM) for 1 h, and then the co-treatment of tiron (100 μM) or TEMPO (300 μM) together with H2O2 (2 mM) for 2 h. Scale bar: 25 μm. Representative images are shown from n = 3 independent experiments.

