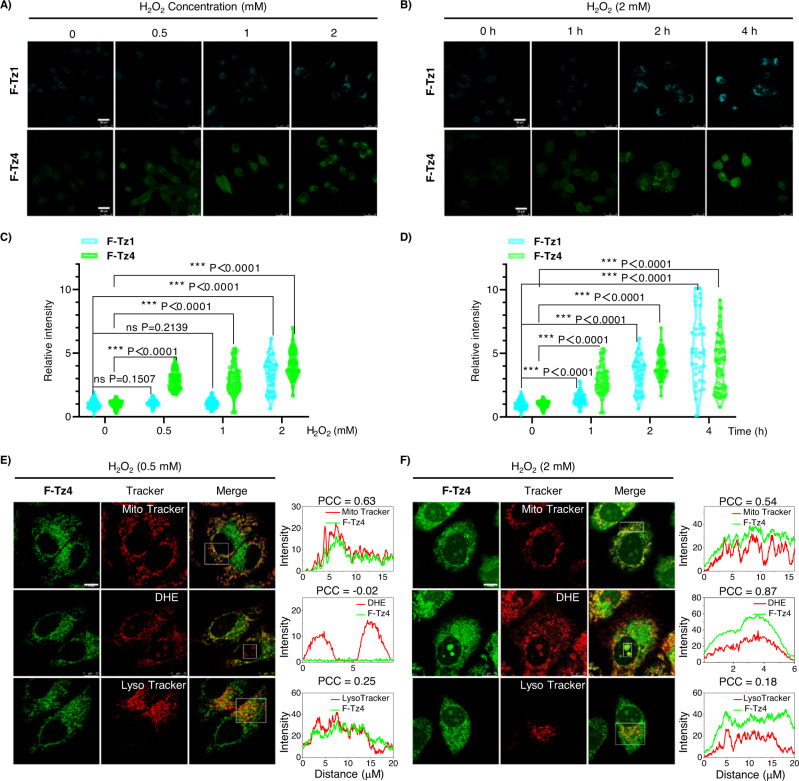
Fig. 3. Multiplexed imaging of cellular superoxide levels with probes F-Tz1 and F-Tz4.
A, B Fluorescence images of HepG2 cells stained with either F-Tz1 or F-Tz4 (each 5 μM, 30 min). Cells were pretreated with various doses of H2O2 for 2 h (A) or 2 mM H2O2 for various time (B). Scale bar: 25 μm. C, D The statistically quantified data on the cellular fluorescence intensity in (A) and (B). The data were normalized to the control group, and P values were analyzed by two-tailed unpaired t-test, 95% Confidence interval. F-Tz1: n = 97 cells for 0 mM H2O2 0 h, n = 45 cells for 0.5 mM H2O2 2 h, n = 66 cells for 1 mM H2O2 2 h, n = 49 cells for 2 mM H2O2 2 h, n = 56 cells for 2 mM H2O2 1 h, n = 41 cells for 2 mM H2O2 4 h; F-Tz4: n = 116 cells for 0 mM H2O2 0 h, n = 78 cells for 0.5 mM H2O2 2 h, n = 68 cells for 1 mM H2O2 2 h, n = 77 cells for 2 mM H2O2 2 h, n = 68 cells for 2 mM H2O2 1 h, n = 74 cells for 2 mM H2O2 4 h. All cell numbers are over three biologically independent experiments. E, F Fluorescence images of HepG2 cells co-stained with F-Tz4 (5 μM, 30 min) and various organelle markers (50 nM Mito Tracker Red CMXRos, 50 nM Lyso Tracker Red, or 5 μM DHE for nuclei, 15 min). Cells were pretreated either with a low (0.5 mM) or high (2 mM) dose of H2O2 for 2 h before being stained with the probes. The right panel showed the intensity profile and PCC (Pearson’s correlation coefficient) along the white rectangle highlighted in the left panel. Scale bars, 10 μm.

