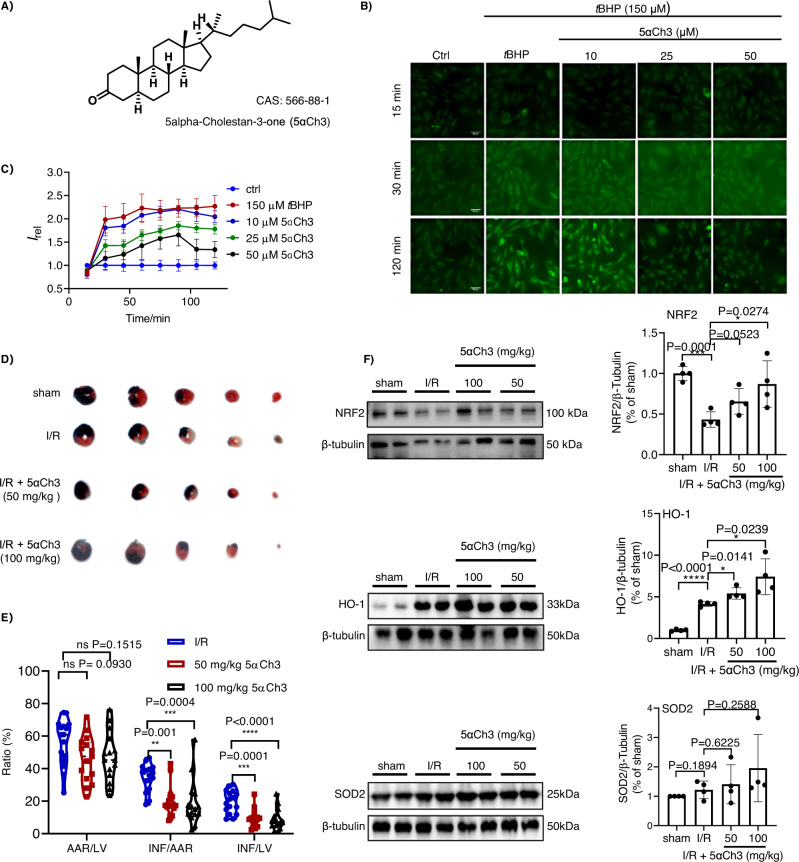
Fig. 6. Verifying the effect of coprostanone to inhibit superoxide overproduction and to ameliorate myocardial I/R injury in mice.
A The molecular structure of coprostanone. B Representative images of H9C2 cells stimulated with tBHP and stained with F-Tz4 (1 μM). Cells were intact (control), treated with tBHP (150 μM), or pretreated with coprostanone (10, 25, 50 µM) for 24 h and then treated with tBHP (150 μM). All cells were co-treated with probe F-Tz4 at the time tBHP was adminstrated. Scale bar: 50 μm. C The statistically quantified data on the cellular fluorescence intensity of cells pretreated with coprostanone (24 h) of different doses, and then treated with tBHP and F-Tz4. The data were the mean ± SD and were normalized to the control group. D Representative photographs of TTC staining of myocardial infarction in mice subjected to myocardial I/R injury with coprostanone pretreatment for 3 days before ischemia. All the mice were anesthetized with tribromoethanol at a dose of 150 mg/kg before surgery. Mice myocardial ischemia and reperfusion injury were induced by the occlusion of the left anterior descending coronary artery for 45 min followed by 24 h reperfusion. The sham-operated group underwent the same procedure without ligation of the left anterior descending coronary artery. E TTC staining ratios of myocardial infarction in mice subjected to myocardial I/R injury (n = 16 mice for I/R group, 15 for 50 mg/kg and 100 mg/kg 5αCh3 group). Data were expressed as mean ± SD and analyzed with one-way ANOVA follwed by Dunnett’s multiple comparisons test. **P < 0.01 vs. I/R group, ***P < 0.001 vs. I/R group, ****P < 0.0001 vs. I/R group; TTC, 2,3,5-triphenyltetrazolium chloride. F Representative Western Blot of NRF2, HO-1, and SOD2 in cardiac tissue lysates, n = 4 mice per group. All data were expressed as means ± SD and were analyzed using unpaired two-tailed t-test, *P < 0.05, **P < 0.01, ***P < 0.001 versus I/R group.

