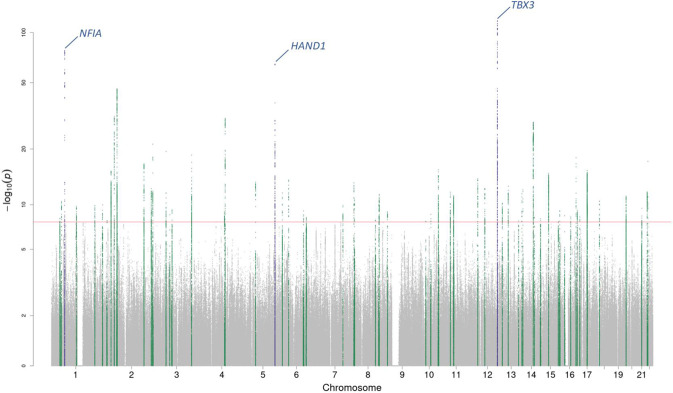
Fig. 2. Manhattan plot for the spQRSTa multi-ancestry meta-analysis.
Manahattan plot for the spatial QRS-T angle (spQRSTa) meta-analysis. Two-sided P-values are plotted on the -log10 scale (Y-axis). The red horizontal line indicates genome-wide significance (P < 5 × 10⁻⁸). Variants within the boundaries of loci previously reported for the spatial QRS-T angle are labelled with the candidate gene and colored blue. Variants at previously unreported loci are green.

