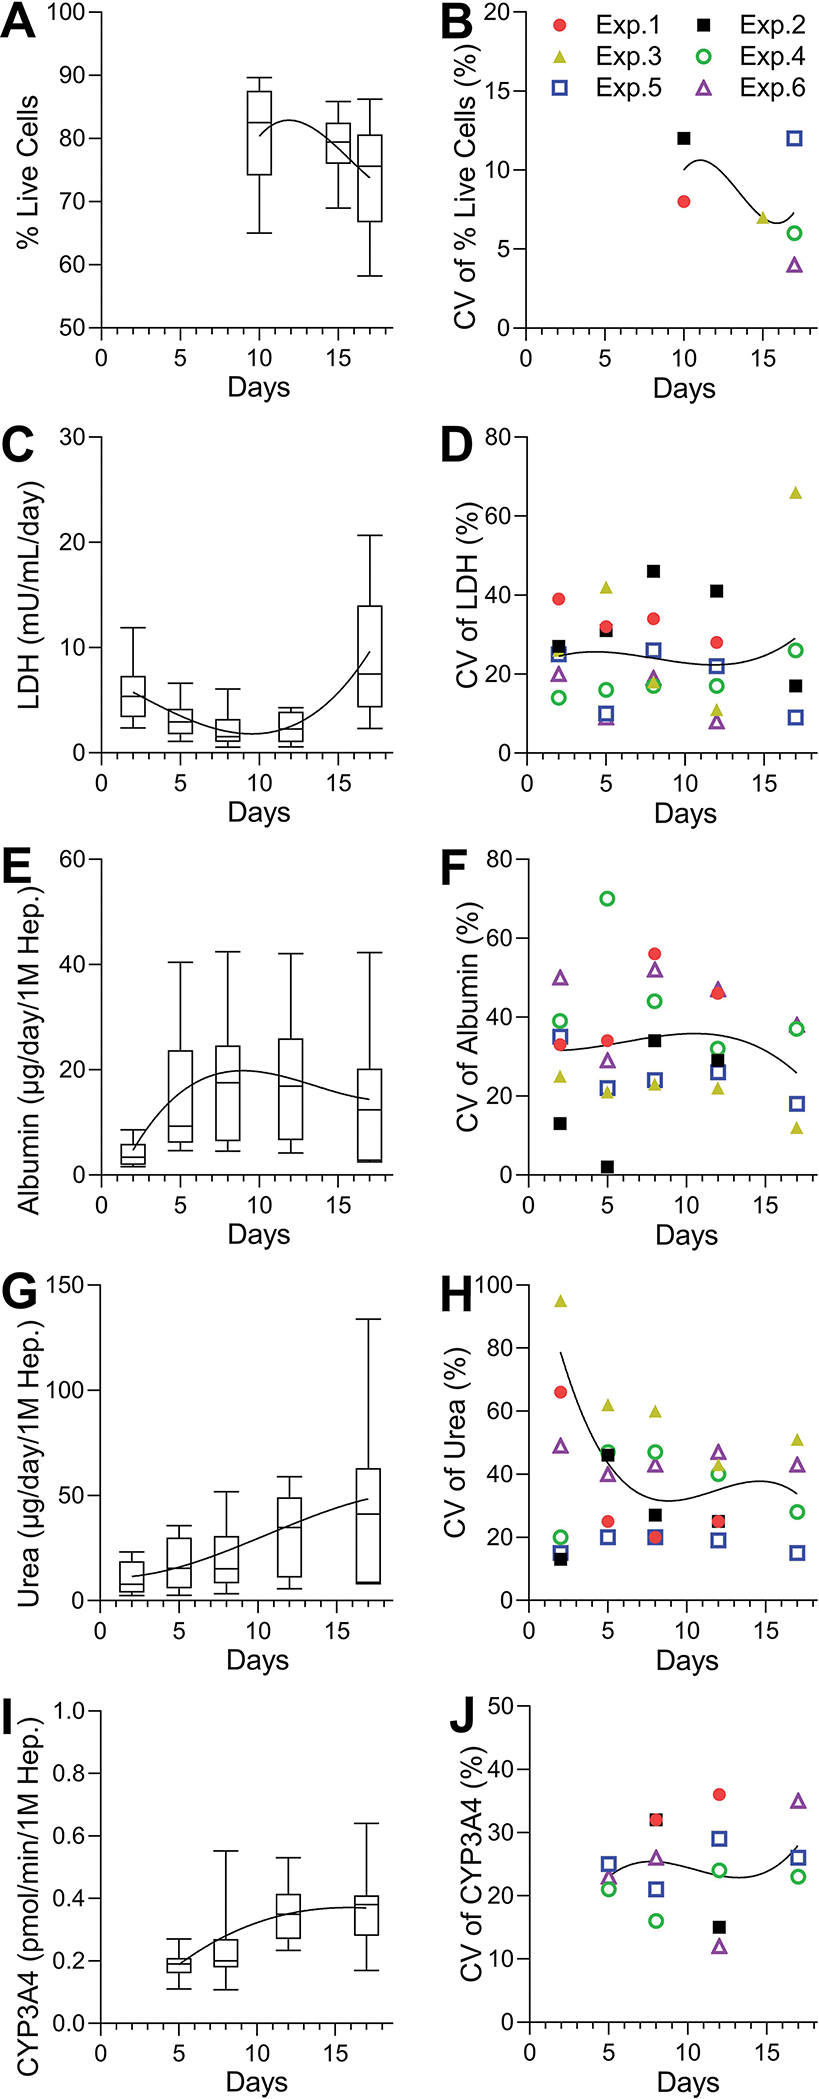
Figure 3. Time trends and variability in repeat control experiments for cell viability, LDH, albumin, urea, and CYP3A4 activity parameters in OrganoPlate® 2-lane 96 plates seeded with iHeps and non-parenchymal cells.

(A, C, E, G, I) Variability for each phenotype as indicated in the y-axis. The values were graphed as box and whiskers (10–90 percentile) by combining data from all experiments (n = 16–31). (B, D, F, H, J) Coefficients of variation and their trends for each phenotype. Data were plotted for each experiment (n = 3–8). Data were combined into 5 representative time points: days 1–3, 4–6, 7–9, 10–13, and 14–17.
