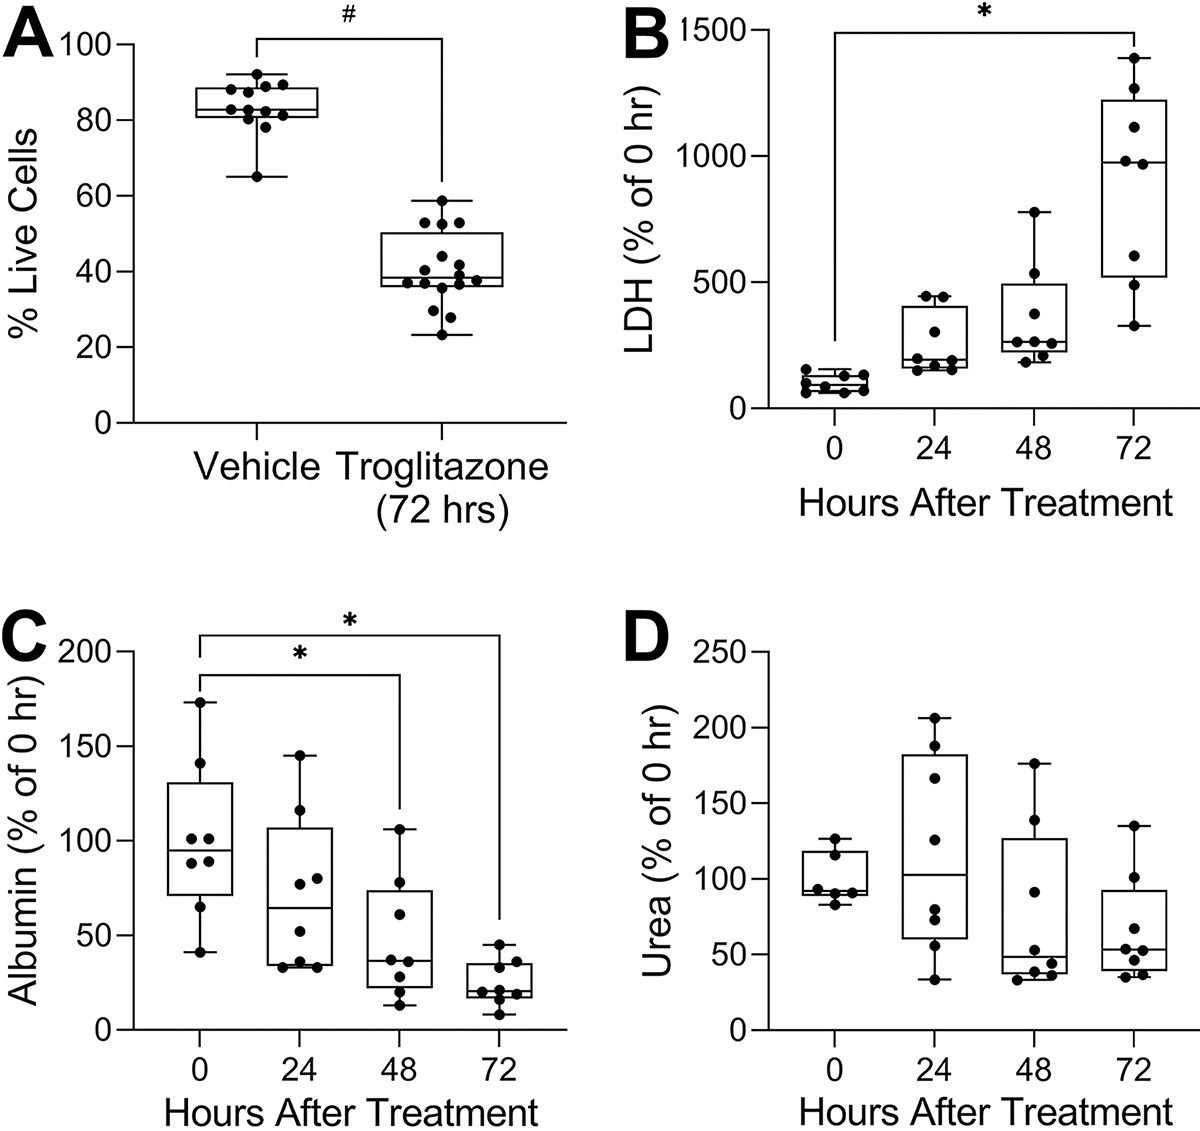
Figure 5. Changes of cell viability, LDH, albumin, and urea after 180 μM troglitazone exposure in OrganoPlate® 2-lane 96 plate seeded with iHeps and non-parenchymal cells.

(A) Image-based cell viability, (B) LDH leakage, (C) albumin secretion, (D) urea secretion. Except for cell viability, endpoints were normalized to the mean of the data at 0 h. Data are plotted as box and whiskers (min-max, n = 8–16). Asterisks indicate statistical significance as follows: (*) is for p < 0.05 by one-way ANOVA with Dunnett’s multiple comparisons test; (#) is for p < 0.05 by unpaired t-test with Welch’s correction.
