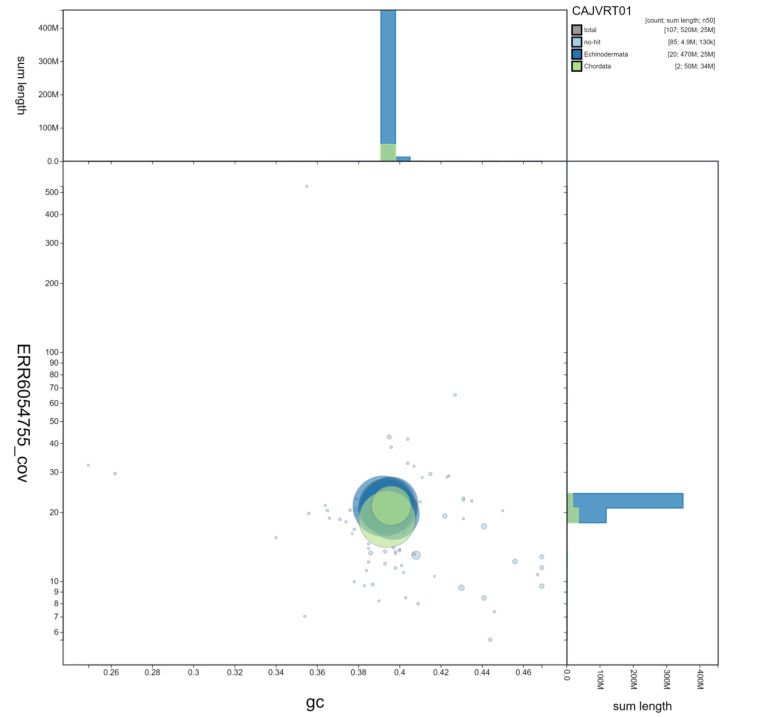
Figure 3. Genome assembly of Marthasterias glacialis, eaMarGlac1.1: GC-coverage.
BlobToolKit GC-coverage plot. Scaffolds are coloured by phylum. Circles are sized in proportion to scaffold length. Histograms show the distribution of scaffold length sum along each axis. Scaffolds labelled Chordata are spurious and assumed to reflect some confusion in the sequence databases from which data is pulled. An interactive version of this figure is available at https://blobtoolkit.genomehubs.org/view/eaMarGlac1.1/dataset/CAJVRT01/blob.

