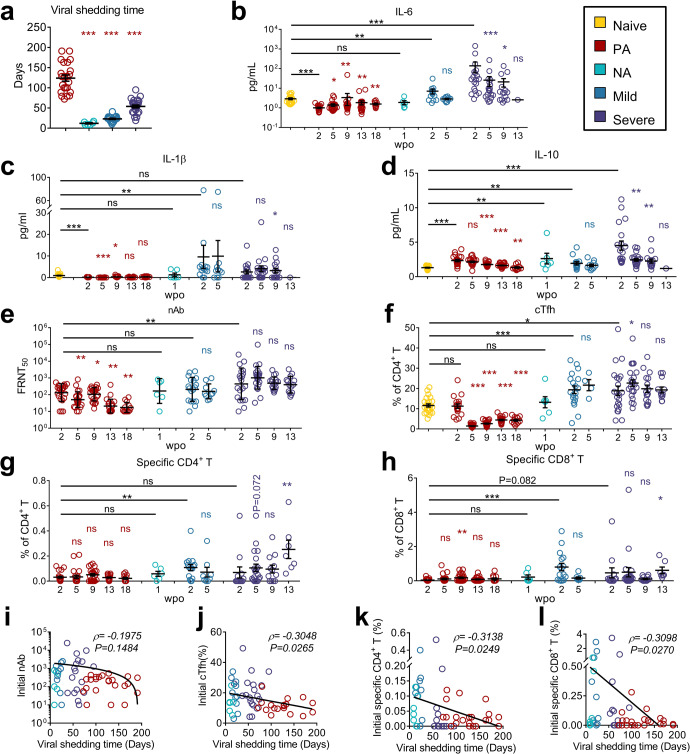
Fig. 1.
Persistent asymptomatic SARS-CoV-2-infected cases exhibited unique immunological features. a Viral shedding times are displayed. Comparisons between NA, Mild, and Severe groups with the PA group, respectively, were performed using Mann–Whitney test. b–h Plasma levels of IL-6 (b), IL-1β (c), IL-10 (d), nAb against SARS-CoV-2 (WT) (e), and frequencies of cTfh (f), specific CD4+ T (g), and specific CD8+ T (h) in PBMCs at various time points post-onset in each group are presented. wpo, weeks post-onset. Wilcoxon matched-pairs signed-rank test was used to compare the data of subsequent time points with the first time point in the same group. Mann–Whitney test was used to compare the data of the first time point in different groups with Naive or PA groups, as indicated. ns: P ≥ 0.05; *P < 0.05; **P < 0.01; ***P < 0.001. i–l Spearman correlation analysis was performed to analyze the correlation between viral shedding time and initial values of nAb (i), cTfh (j), specific CD4+ (k), and CD8+(l) T-cell frequencies, and the data of the four groups are presented. Data collected at the first time point for each patient was defined as the initial values. Each circle indicates an individual case, and the horizontal black lines indicate the mean ± SEM or geometric mean ± geometric SD (e) values. Naive, SARS-CoV-2-naive participants; PA, persistent asymptomatic SARS-CoV-2-infected cases; NA, non-persistent asymptomatic SARS-CoV-2-infected cases; Mild, patients with mild COVID-19; Severe, patients with severe COVID-19

