Fig. 3.
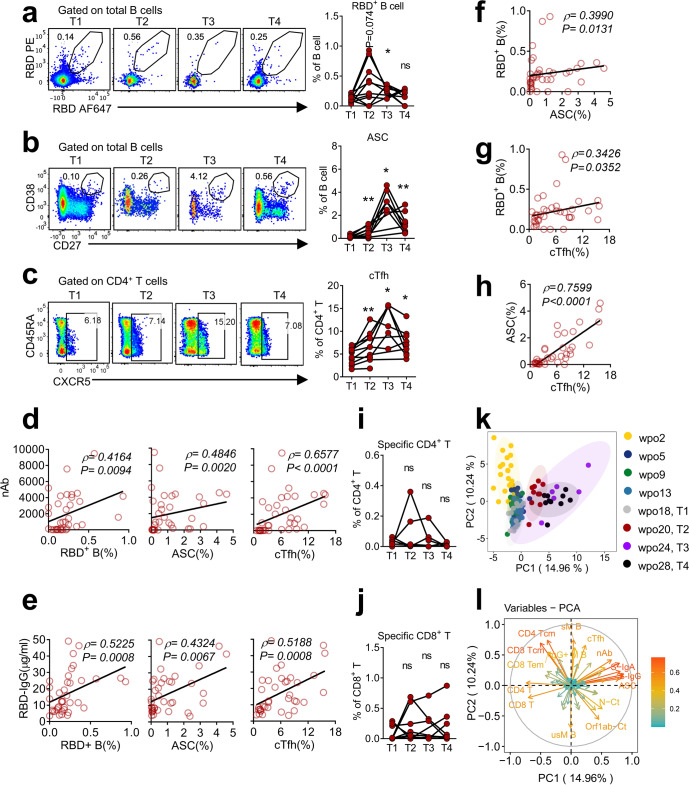
Ad5-nCoV vaccination enhanced B-cell and cTfh responses in PA cases; these responses were positively correlated with nAbs. a–c Frequencies of RBD+ B cells (a), ASCs (b), and cTfhs (c) in PBMCs of PA cases post vaccination are presented. Representative flow plots displaying the gating of RBD+ B cells (a), ASCs (b) and cTfhs (c) are presented on the left, and summary panels are presented on the right. d–h Spearman correlation analysis was performed to analyze the correlations among nAbs, RBD-IgG, RBD+ B cells, ASCs and cTfhs. i, j Frequencies of specific CD4+ (i) and CD8+ (j) T cells in PA cases post vaccination are presented. k PCA plot showing the distribution of patients in the PA group at different time points. Each dot represents a case. l PCA plot displaying corresponding trajectories of key markers affecting separation between groups. a–c, i, j Wilcoxon matched-pairs signed-rank test was conducted to compare data between T1 and other time points, respectively

