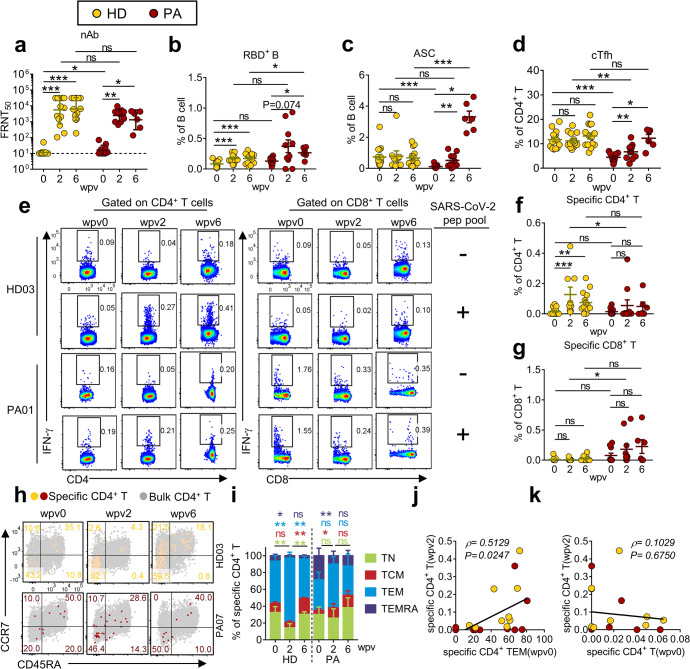
Fig. 5.
Ad5-nCoV vaccination induced distinct immune profiles in PA and HD groups. a–g Comparisons of nAbs against SARS-CoV-2 (WT) (a), RBD+ B cells (b), ASCs (c), cTfhs (d), specific CD4+ T cells (f), and specific CD8+ T cells (g) at 0, 2, and 6 wpv between PA and HD groups (SARS-CoV-2-naive participants who had completed two doses of inactivated vaccine) are presented. Representative flow plots of specific CD4+ and CD8+ T cells are presented (e). f, g The presented values were obtained with the formula: (unstimulated cells − (peptide-stimulated cells)). h, i Representative flow plots (h) and summary (i) of memory subsets of specific CD4+ T cells at 0, 2, and 6 wpv in the two groups are presented. Wilcoxon matched-pairs signed-rank test was performed to compare the data between different time points in the same group. j, k Spearman correlation test was conducted to analyze the correlation between specific CD4+ TEM (0 wpv) and specific CD4+ T (2 wpv) (j), and between specific CD4+ T before (wpv0) and after (wpv2) vaccination (k). nAb titers are presented as geometric mean ± geometric SD. Other data are presented as mean ± SEM

