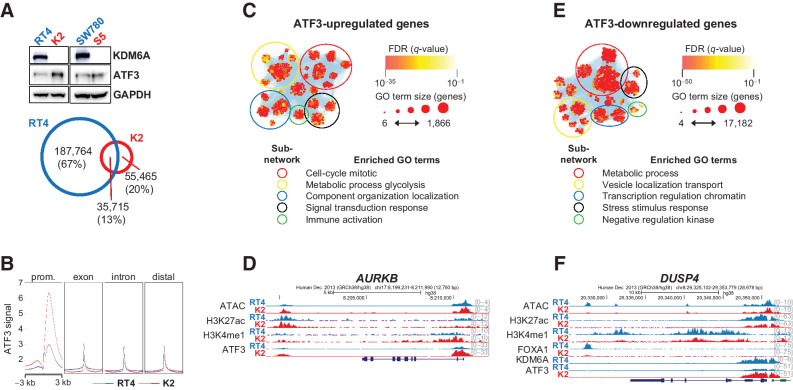
Figure 6.
ATF3 transcription circuit activation after KDM6A loss. A, Top, ATF3 expression in parental (blue) and KDM6A knockout (red) cells. Bottom, Venn diagram showing shared and private ATF3 peaks in RT4 parental and K2 knockout cells. B, ATF3 CUT&RUN signal at annotated genomic contexts. C, Functional enrichment analysis of ATF3-bound genes that are upregulated in knockout cells. D, Genome browser view of AURKB, a cell-cycle gene activated by ATF3 in knockout cells. E, Functional enrichment analysis of ATF3-bound genes that are downregulated in knockout cells. F, Genome browser view of DUSP4, a MAPK pathway regulator that is repressed in knockout cells.

