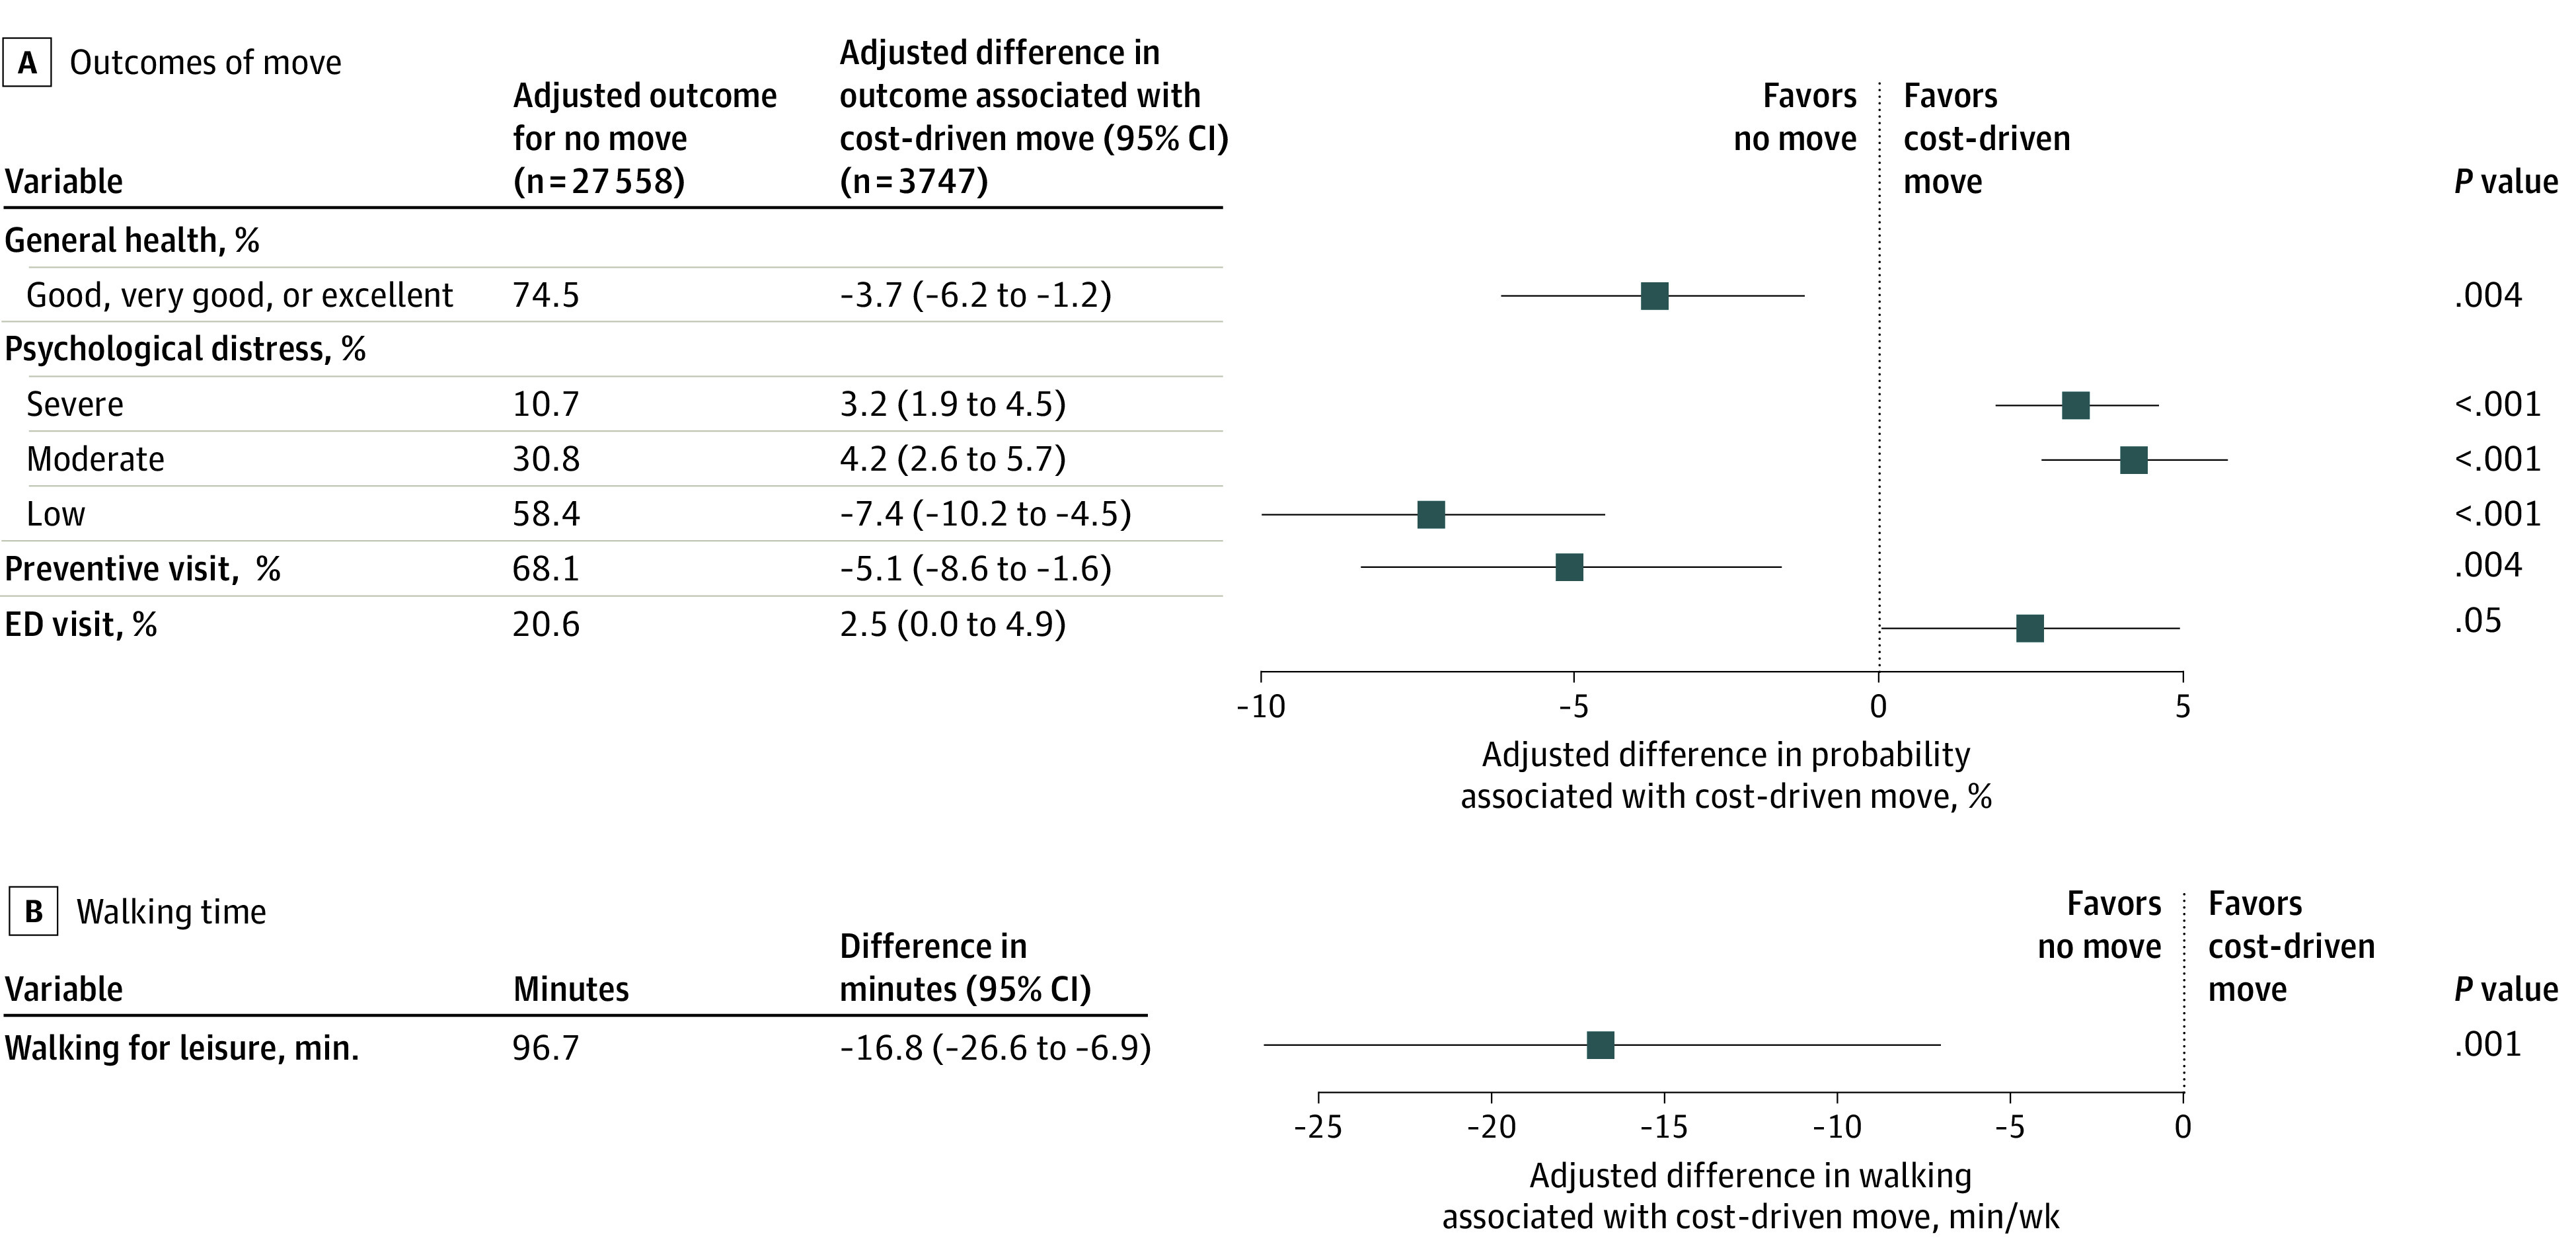
Figure 1. Adjusted Associations Between Cost-Driven Residential Moves and Health-Related Outcomes Relative to No Residential Move.

Unweighted sample sizes are shown; all other values represent weighted estimates. Average marginal effects are shown in the forest plot, with 95% CIs indicated by whiskers. All models were adjusted for sex, race and ethnicity, family composition, age, age squared, employment status, educational attainment, income, housing type, urbanicity, limited English language proficiency, citizenship, and survey year. Preventive care visit and ED visit models were also adjusted for health insurance type. ED indicates emergency department.
