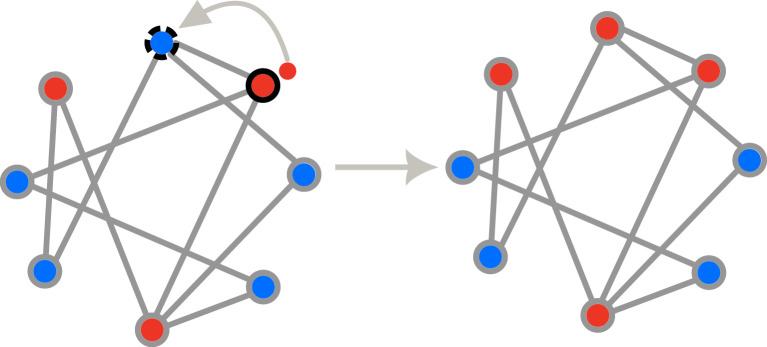
Figure 1.
Different update schemes for graph of individuals. We consider an arbitrary population structure of size eight with five wild-type individuals (blue) and three mutant individuals (red). Neighbours are connected via links. Individual marked with solid black circle represents the birth giving parent, whereas, the individual marked with black dashed circle is the one chosen for death. The population size remains constant throughout the dynamics with offspring replacing dead individuals. Assuming that the selection parameter for birth of a mutant individual is r = 2 (1 for the wild-type) and that the selection parameter for death of the mutant is t = 1/2 (1 for the wild-type), the probabilities that the transition shown in the figure takes place are different for the different update mechanisms shown in table 1. For example, in the case of BD, the probability to choose this particular mutant individual for birth is . The probability to choose this particular wild-type neighbour for death is , which leads to a probability for the event shown. Similarly, we find: Bd: . bD: . bd: . DB: . Db: . dB: . db: .

