. 2023 Feb 28;6:e40937. doi: 10.2196/40937
©Elisa Mancinelli, Gaia Dell'Arciprete, Davide Pattarozzi, Silvia Gabrielli, Silvia Salcuni. Originally published in JMIR Pediatrics and Parenting (https://pediatrics.jmir.org), 28.02.2023.
This is an open-access article distributed under the terms of the Creative Commons Attribution License (https://creativecommons.org/licenses/by/4.0/), which permits unrestricted use, distribution, and reproduction in any medium, provided the original work, first published in JMIR Pediatrics and Parenting, is properly cited. The complete bibliographic information, a link to the original publication on https://pediatrics.jmir.org, as well as this copyright and license information must be included.
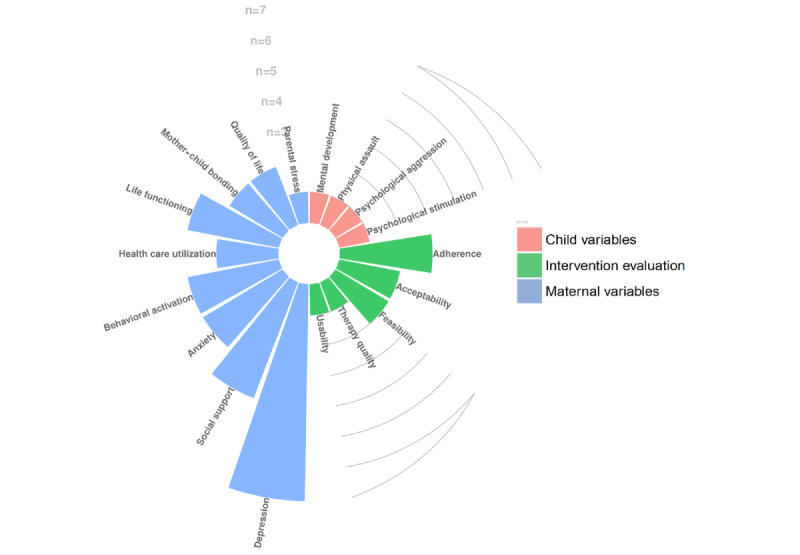
Figure 2.

Circular bar plot of the main outcomes of the studies. n=frequency of the outcomes reported by the included studies.
