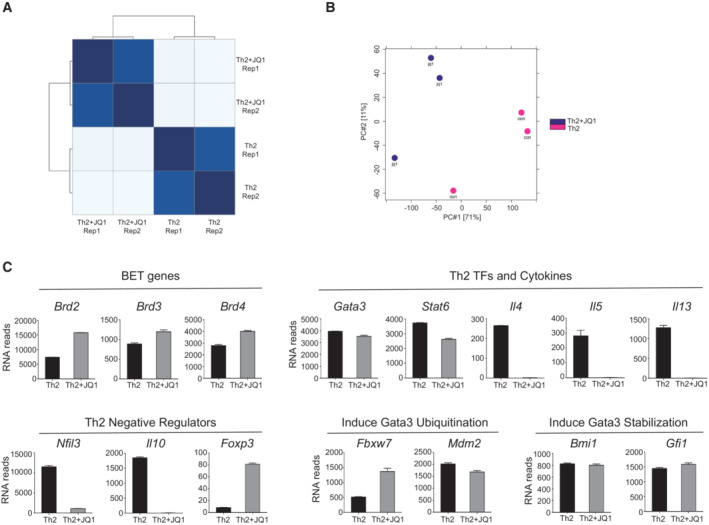
Figure EV3. RNA‐seq and ChIP‐seq analysis of Brd4 in Th2 cells.

- Heatmap of sample‐to‐sample distance of RNA‐seq analysis in mouse Th2 cells treated with or without JQ1.
- Principal component analysis of ChIP‐seq peaks in mouse Th2 cells treated with or without JQ1.
- RNA‐seq data analysis showing expression of key genes in mouse Th2 cells treated with or without JQ1 (250 nM).
Data information: Mouse naïve CD4+ T cells were cultured in Th2 polarization condition and treated with or without inhibitors on Day 0 and were differentiated for 6 days before analysis, unless otherwise specified. Data are representative of two to three biological replicates.
