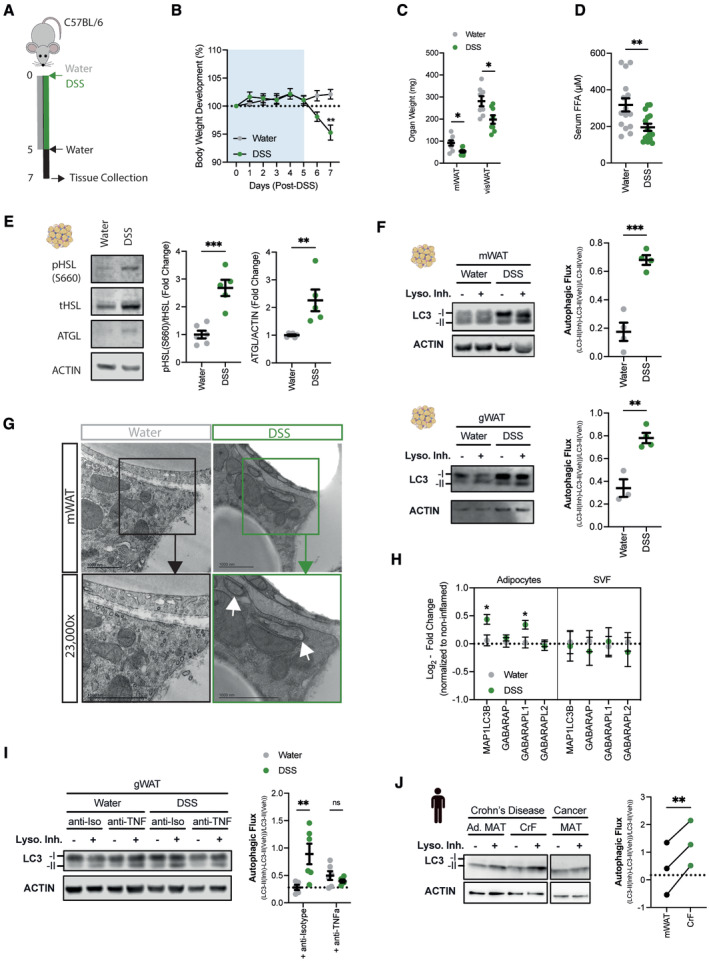
Figure 1. Intestinal inflammation promotes lipolysis and autophagy in adipose tissues.

- Schematic of experimental design. Sex‐matched and age‐matched wild‐type mice were treated for 5 days with 1.5–2% DSS in drinking water, before switched to water for two more days. Mice were sacrificed on day 7 post‐DSS induction.
- Body weight development upon DSS treatment (n = 13/group).
- Tissue weights measured in mesenteric (mWAT) and collective visceral white adipose tissue (visWAT), consisting of gonadal (gWAT), retroperitoneal and omental white adipose tissue on day 7 after start of DSS regime (n = 8/group).
- Circulating serum levels of FFA during DSS‐induced colitis on day 7 (n = 15/group).
- Representative immunoblot for key lipolytic enzymes HSL and ATGL protein expression and quantification (n = 5–6/group).
- Immunoblot analysis of autophagic flux in mWAT (upper panel) and gWAT (lower panel) adipose tissue stimulated ex vivo with lysosomal inhibitors 100 nM Bafilomycin A1 and 20 mM NH4Cl for 4 h or DMSO (Vehicle) (n = 3–4/group).
- Representative transmission electron microscopy images from mesenteric adipose tissue 7 days post DSS‐induced colitis induction. Lower panel is showing magnification of selected area. White arrows show autophagosomal structures.
- Atg8 homologs expression was measured by qPCR in visceral adipocytes fraction (left panel) and stromal vascular fraction (right panel) during DSS‐induced colitis (n = 7–8/group).
- Representative immunoblot for LC3‐I/‐II protein expression and quantification of autophagic flux in gWAT via ex vivo lysosomal inhibition using 100 nM Bafilomycin A1 and 20 mM NH4Cl for 4 h or DMSO (Vehicle). Mice were initially treated with 500 μg anti‐TNFα antibody or isotype control, before administrating DSS in drinking water for 5 days. Mice were sacrificed on day 7 post‐DSS induction (n = 5–6/group).
- Representative immunoblot for LC3‐I/‐II and ACTIN protein expression and quantification of autophagic flux in creeping fat tissues (CrF) and adjacent mesenteric adipose tissues (Ad. MAT) of Crohn's disease patients (n = 3/group). Additionally, autophagic flux was determined in the mesenteric adipose tissue (MAT) of a colorectal cancer patient as control (dotted line).
Data are represented as mean ± s.e.m. (B) Two‐Way repeated measures ANOVA. (C–E, G) Unpaired Student's t‐test. (I) Two‐Way ANOVA. (J) Paired Student's t‐test. *P < 0.05, **P < 0.01, ***P < 0.001.
Source data are available online for this figure.
