
Figure EV1. DSS leads to efficient induction of intestinal inflammation.
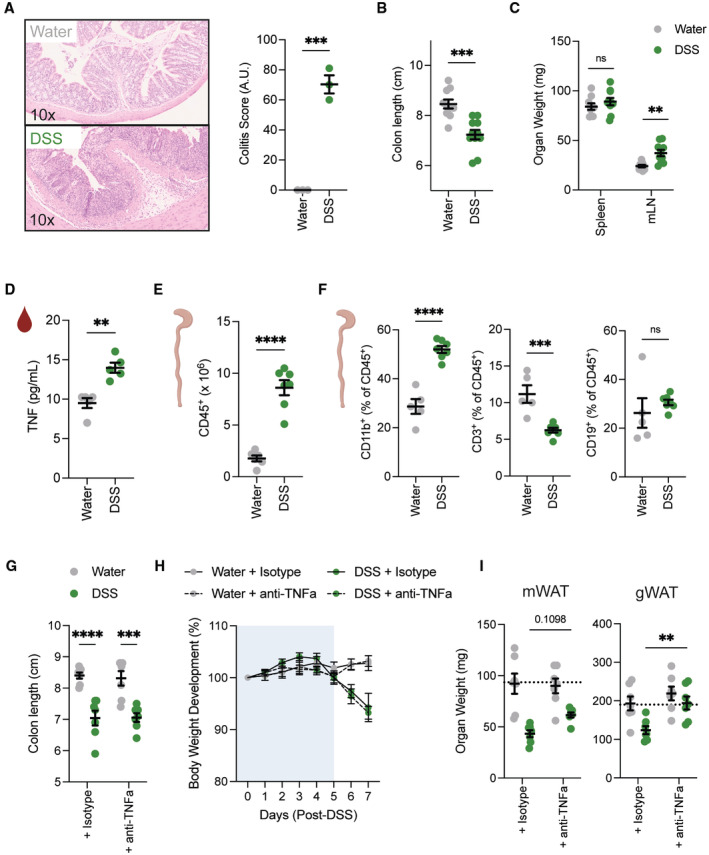
- Representative H&E staining of colon histology and quantification on day 7 after DSS colitis induction (n = 3/group) from one independent experiment.
- Colon length measured after 1.5–2% DSS colitis regime on day 7 (n = 10–11/group).
- Spleen weight and mesenteric lymph node weight after 1.5–2% colitis regime on day 7 (n = 9–10/group).
- TNFα levels in serum were measured in wild‐type mice on day 7 after water and DSS treatment (n = 5/group).
- Absolute number of colonic CD45+ immune cells on day 7 post‐DSS treatment (n = 6–7/group).
- Frequency of CD11b+ myeloid cells, CD3+ T cells and CD19+ B cells in colon on day 7 post‐DSS treatment (n = 5–7/group).
- Colon length of mice upon DSS‐induced colitis treated with anti‐isotype or anti‐TNFα neutralizing antibody (n = 7/group).
- Body weight development upon DSS‐induced colitis of mice treated either with anti‐isotype or anti‐TNFα neutralizing antibody (n = 7/group).
- Tissue weight of mWAT or gWAT upon DSS‐induced colitis of mice treated either with anti‐isotype or anti‐TNFα neutralizing antibody (n = 7/group).
Data are represented as mean ± s.e.m. (A–E) Unpaired Student's t‐test. (G, I) Two‐way ANOVA. (H) Repeat‐measure two‐way ANOVA. **P < 0.01, ***P < 0.001, ****P < 0.0001.
Source data are available online for this figure.