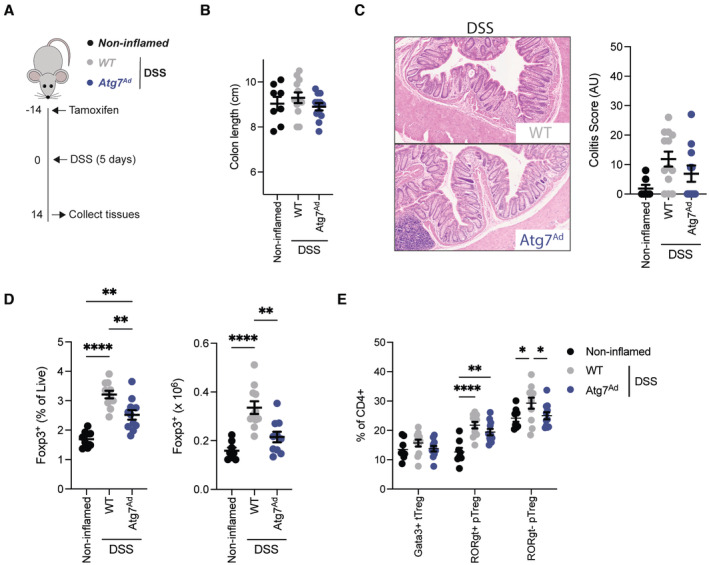
Figure EV2. Expansion of intestinal Treg populations is blunted in adipocyte autophagy‐deficient mice without affecting intestinal resolution.

- Schematic of experimental design. Sex‐matched and age‐matched littermates were treated with DSS for 5 days and mice were sacrificed 14 days after start of DSS treatment.
- Colon length from noninflamed control mice (n = 8/group), adipocyte autophagy‐sufficient WT mice and adipocyte autophagy‐deficient mice (n = 12/group).
- Representative H&E staining images (10× magnification) of distal colon sections and quantification of histopathological score (n = 7–13/group).
- Frequency (left panel) and absolute number (right panel) of CD4+ FOXP3+ cells in the colon on day 14 post‐DSS treatment (n = 8–11/group).
- Frequency of peripheral and thymic Treg (pTreg and tTreg, respectively) cell populations in colon on day 14 post‐DSS treatment (n = 8–11/group).
