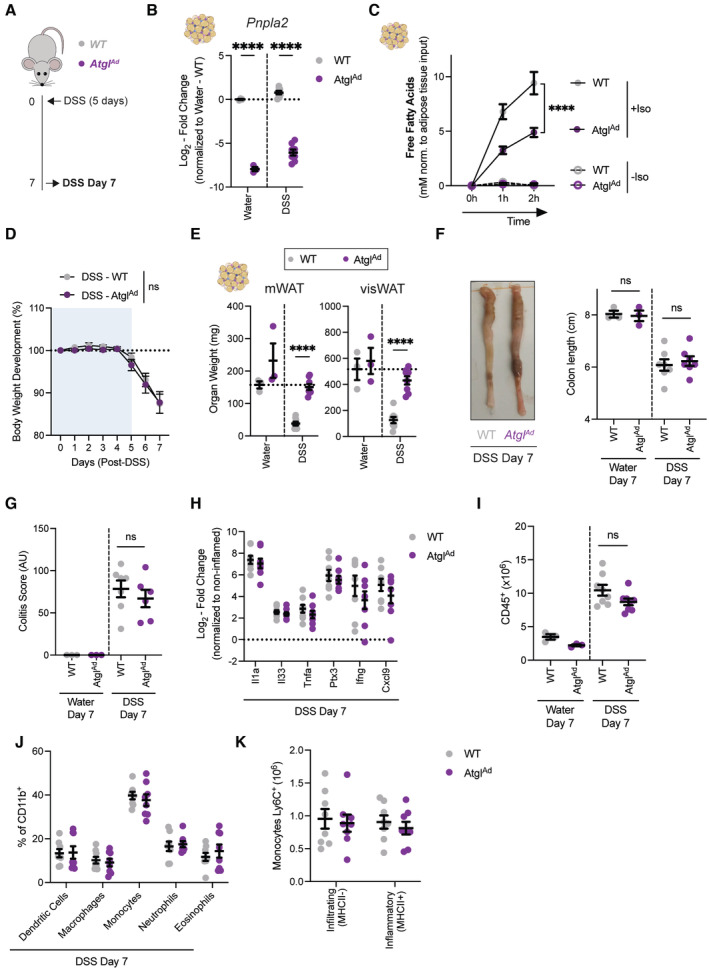
Figure 4. Adipocyte‐specific loss of Atgl was dispensable for regulation of intestinal inflammation.

- Schematic of experimental design. DSS‐induced colitis was induced in sex‐matched and age‐matched littermates.
- Representative quantification of knockout efficiency measured on Atgl transcript level by qRT‐PCR in purified primary visceral adipocyte (n = 3–8/group).
- Ex vivo lipolysis assays on Atg7‐deficient adipose tissue explants simulated with isoproterenol (10 μM) for 1–2 h (n = 5–6/group).
- Body weight development upon DSS treatment (n = 8/group).
- Tissue weights of mWAT and visWAT on day 7 after start of DSS (n = 3–8/group).
- Colon length after DSS on day 7 (n = 3–8/group).
- Quantification of histological score at steady state (n = 3/group) and DSS colitis (n = 6–7/group).
- Expression of pro‐inflammatory cytokines in colon tissues on 7 days post‐DSS induction (n = 8/group). Dotted line represents noninflamed controls.
- Absolute number CD45+ immune cells from colons on 7 days post‐DSS induction (n = 3–8/group).
- Frequency of myeloid cell population in colon on day 7 post‐DSS induction (n = 8/group).
- Absolute number of Ly6C+ monocytes discriminated by the absence or presence of MHCII for infiltrating and inflammatory monocytes, respectively (n = 8/group).
Data are represented as mean ± s.e.m. (B, E–I, K) Unpaired Student's t‐test. (D) Two‐Way repeated measures ANOVA. (C, J) Two‐Way ANOVA. ****P < 0.0001.
Source data are available online for this figure.
